How to Use Flowcharts to Plan Your Processes and Workflow
Learning how to use flowcharts can feel a bit daunting at first. However, taking the time to master flowcharts will make it much easier to plan your processes and workflow. As a result, you should find that your future projects move more efficiently. You could also improve the accuracy of your team’s work by identifying potential problems before they stall your progress.
To get the most out of flowcharts, you will need to start with the basics. At a simple level, they work like decision trees. Once you master basic flowcharts, you can learn how to use flowcharts in more advanced ways that make all of your projects more successful.
Why you should use flowcharts
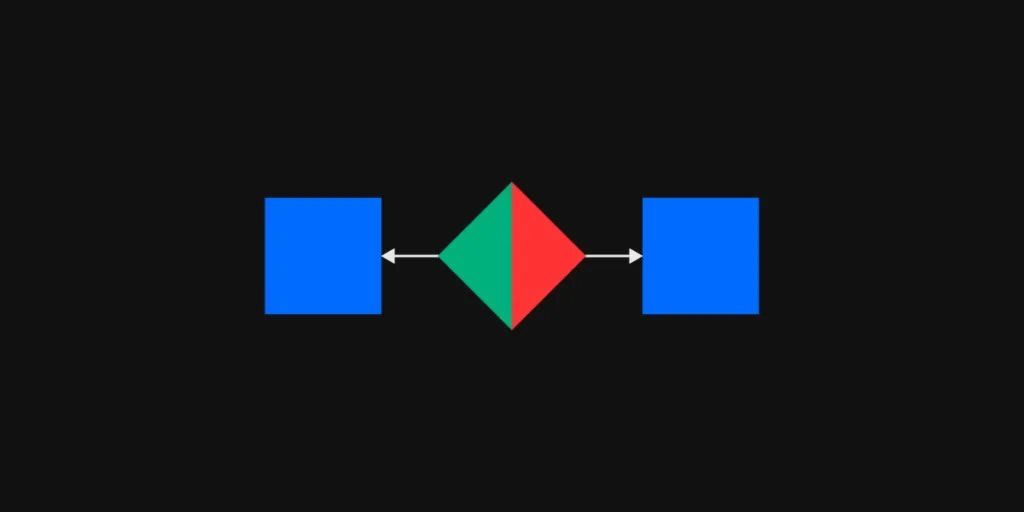
Flowcharts simplify big questions by breaking them down into small steps. Instead of making a decision based on instinct, you move through a series of logical steps to reach a conclusion.
Depending on the question you want to answer, flowcharts can become quite complex. No matter how complicated they seem, though, they will help you find logical solutions to questions that arise before, during, and after projects.
Some noted benefits of flowcharts include:
- Visual clarity that shows how complex processes function.
- Instant communication that lets you explain processes to multiple people.
- Efficient coordination that helps people make decisions efficiently.
- Effective analysis that lets you review your current process to find areas for improvements.
Flowchart symbols and their meanings
Traditional flowcharts use geometric shapes to represent functions. Some of the symbols have obvious meanings. Others will take a little effort to remember. It won’t take long before everyone on your team knows how to interpret the following flowchart symbols.
Oval

- Name: Start/End
- Function: Represents the beginning or end of a process.
- Example: “Start your process here.”
Arrows

- Name: Arrows
- Function: Tells you which step to move to after completing a task or answering a question.
- Example: “Move to the next step.”
Parallelograms

- Name: Input/Output
- Function: Represents an input or output that will influence the decision-making process.
- Example: “The number of people currently using your product.”
Rectangles

- Name: Process
- Function: Tells you to what process to use with the available information.
- Example: “Add current and expected users to determine whether the client’s server has enough power to complete requests.”
Diamonds

- Name: Decision
- Function: Asks you to make a decision.
- Example: “Do you want to give users more options or simplify your design?”
These aren’t the only symbols and functions used in flowcharts, but they can help you design simple processes and workflows. For a more complete list of flowchart symbols and what they mean, read Lucidchart’s What is a Flowchart article. It also provides a historical background that may help you understand more about the benefits and potential uses of flowcharts.
Exercise: How to create a simple flowchart
Let’s start learning how to use flowcharts to plan your processes and workflows by looking at an example that answers a very simple question.
“Should we build a version of our application for the App store?”
The flowchart used to answer this question might include the following:
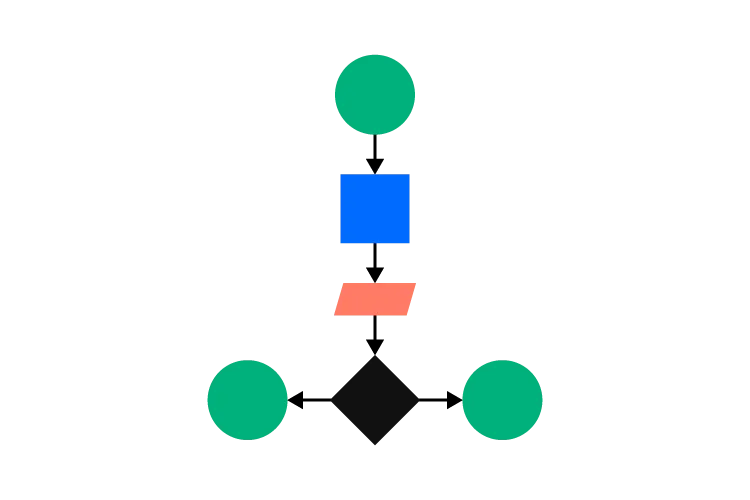
Oval: begin the process to find a logical answer.
Arrow
Rectangle: Number of people downloading the app from Google Play
Arrow
Parallelogram: Enter the number of current users
Arrow
Diamond: Does our current number of users cover our expenses and generate revenue: yes or no?
Arrow: Yes
Oval: Don’t spend more money developing a new version of the app.
Arrow: No
Oval: Build a new version to attract more users.
Think of a simple question that you encountered today and make a flowchart that helps you reach a decision. It could apply to anything, such as whether you need to stop for gas on the way home or whether you should get another cup of coffee during your next break.
When you practice using simple flowcharts, you can work your way toward using them to answer much more complex questions. You will also discover that you can use the step-by-step method to improve your product design process. For example, a section of your flowchart might ask:
- Do users understand what the icons mean?
- If not, redesign the icons and ask users for more feedback.
- If yes, use the icons and proceed to the next stage of the project.
How to use flowcharts to help your team work more efficiently
Do members of your team come to you with questions that distract you from other aspects of your job? Flowcharts could help them work more efficiently without as much oversight.
If you get similar questions frequently, sit down to make a flowchart that shows your thought process that leads to answers. Yes, it will take you some time to investigate your thought processes, turn them into instructions, and draw a flowchart that others can follow easily. Investing some time in the flowchart, however, should reduce the number of repetitive questions that you get from designers working on your projects.
UXPin’s wireframing feature gives you an easy way to create attractive flowcharts that you can distribute among your team members. You can even keep a copy of the flowchart and share it with new employees and freelance designers by sending them a preview link. They don’t need a UXPin membership to see the preview, so you can simplify the process without spending more money adding people to your account.
Ways UXPin can help make your processes and workflows more efficient
Knowing how to use flowcharts will help your projects. Not everything relies on using a graph to make informed decisions, though. UXPin has several features that will make your processes and workflows more efficient. We encourage you to use workflows, but you don’t have to make them all the time.
Some of the top workflow features that come with UXPin include the following.
Collaboration for cross-functional teams
UXPin gives your team an environment where they can collaborate in real-time. When one person changes a design, everyone else looking at the project can see the changes as they occur.

Depending on the types of products you make, though, you might need enhanced collaboration features that meet the needs of cross-functional teams. For example, you might want a single place where designers and coders can leave project comments that guide their work toward a cohesive goal.
You won’t get that with every tool. UXPin makes it very easy for anyone you invite to get involved.
Design systems that create guardrails
Design systems create a standardized set of assets, colors, interactive components, and other features that designers can use while working on a project. If a designer has a question, the design system can probably answer it.
UXPin lets you create a new design system for each project. You can also import some aspects of other design systems to new projects. With the right library of standards, everyone can work more efficiently without making critical mistakes.
Try UXPin to see how it improves your workflows and processes
Interested in learning more about how UXPin can improve your workflows and processes? Sign up for a free 14-day trial so you can explore the cloud-based platform’s features. You don’t have to provide a credit card number, so you never have to worry about getting charged for a membership you don’t want. Instead, you get a free opportunity to try UXPin without any obligations.