Monitoring AI-based test automation in CI/CD pipelines ensures reliable performance and cost efficiency. Unlike conventional testing tools, AI introduces challenges like inconsistent outputs, skipped steps, or expensive API usage. Without proper oversight, these issues can lead to unreliable results, higher costs, and wasted efforts.
Key Takeaways:
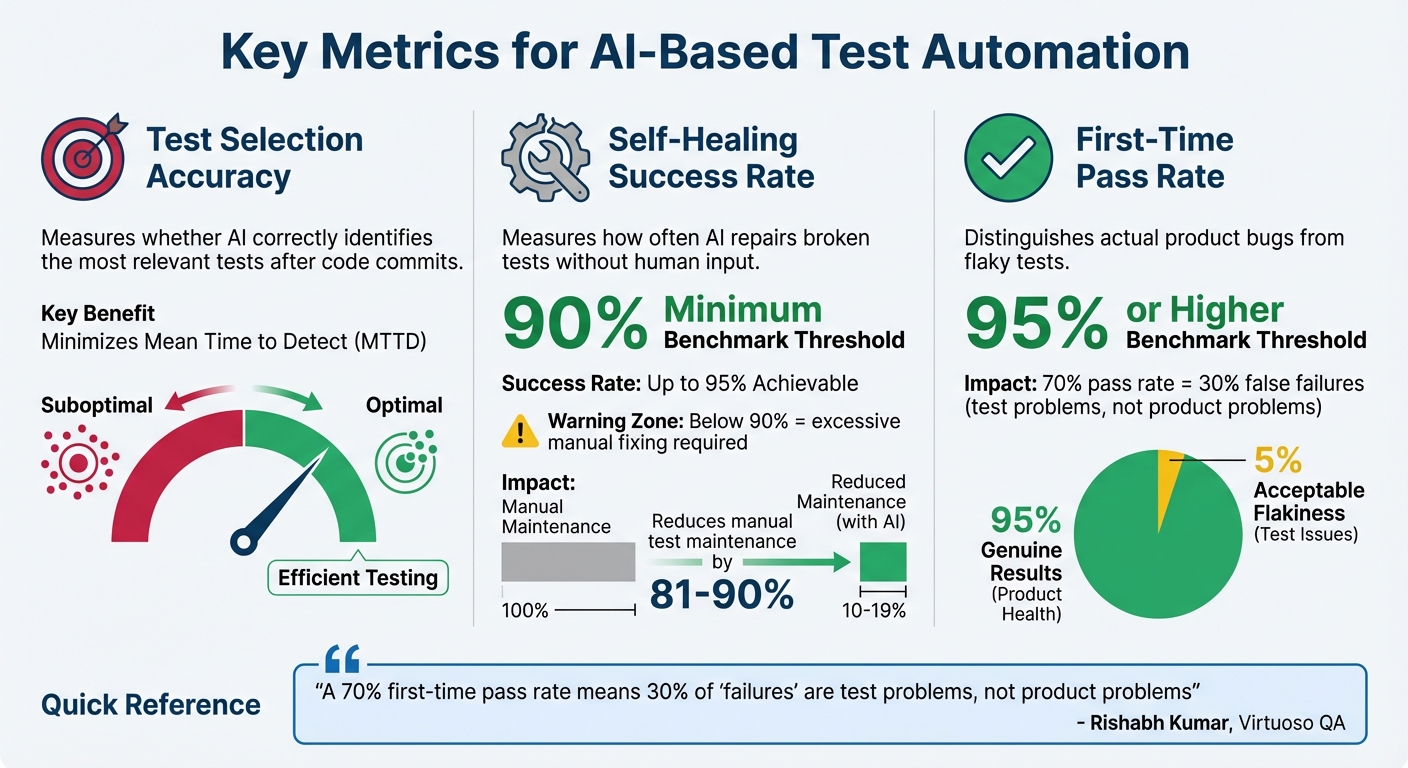
- Metrics to Track: Focus on Test Selection Accuracy, Self-Healing Success Rate, and First-Time Pass Rate to ensure efficient and accurate testing.
- Monitoring Tools: Use tools integrated with platforms like GitHub/GitLab for build stages, SDKs for test execution, and solutions like Datadog for post-deployment analysis.
- Dashboards and Alerts: Create real-time dashboards with clear metrics and set meaningful alerts to catch anomalies without overwhelming the team.
- Cost Control: Monitor token usage and API calls to prevent budget overruns.
- Improvement Loop: Use monitoring data to identify recurring issues and retrain AI models for better results.
Integrating Result Analysis Tools | Test Automation Framework Development | Part 11
Key Metrics to Track for AI-Based Test Automation
Key Metrics for AI-Based Test Automation in CI/CD Pipelines
To make AI test automation truly effective, you need to track the right metrics. Unlike traditional testing – where the focus is on counting passed and failed tests – AI-based automation requires evaluating how well the intelligence layer performs. Here are three key metrics that can help you determine if your AI is delivering value in your CI/CD pipeline.
Test Selection Accuracy is all about determining whether the AI is correctly identifying the most relevant tests after each code commit. By analyzing code changes, the AI selects tests that are most likely to uncover issues. You can measure accuracy by comparing the AI’s selections to a predefined benchmark dataset, which acts as your "ground truth". If this metric drops, you may end up running unnecessary tests or, worse, skipping critical ones. The goal is to detect defects quickly while keeping the execution time low, minimizing the Mean Time to Detect (MTTD).
Self-Healing Success Rate measures how often the AI repairs broken tests without requiring human input. For example, if a button ID changes, traditional tests would fail until someone manually updates the selector. AI self-healing, however, can adapt to such changes automatically. With success rates reaching up to 95%, this technology can reduce manual test maintenance by as much as 81% to 90%. If your self-healing rate falls below 90%, you might find yourself spending too much time fixing tests instead of focusing on building new features.
Another critical metric is the First-Time Pass Rate, which highlights the difference between actual product bugs and flaky tests that fail inconsistently. A strong CI/CD pipeline should aim for a first-time pass rate of 95% or higher. As Rishabh Kumar, Marketing Lead at Virtuoso QA, explains:
"A 70% first-time pass rate means 30% of ‘failures’ are test problems, not product problems".
If your first-time pass rate is below 95%, it suggests that a significant portion of failures could be due to unreliable tests rather than genuine product issues. To address this, you should also monitor Flaky Test Detection and Anomaly Rates. AI-driven tools can reduce flakiness by identifying and addressing inconsistent behaviors, ensuring that test failures point to real defects worth investigating. Together, these metrics are essential for maintaining a smooth and accurate CI/CD pipeline.
Adding Monitoring Tools to Your CI/CD Pipeline
Incorporating monitoring tools into your CI/CD pipeline goes beyond tracking simple pass/fail results. It’s about keeping an eye on AI-specific behaviors that are crucial for maintaining reliability. At each stage of the pipeline, monitoring should be tailored to capture elements like self-healing decisions and test selection logic, rather than sticking to traditional metrics.
Monitoring During Build Stages
The moment new code enters your repository, AI monitoring should kick in. Tools that integrate with version control platforms like GitHub or GitLab – using webhooks or Git APIs – can analyze commits and pull requests. These tools enable the AI to evaluate risks and recommend which tests to run based on the nature of the code changes. To keep things secure, store API keys and credentials as environment variables within your CI/CD platform (e.g., GitHub Secrets) instead of embedding them directly in scripts. Additionally, tracking prompt versions and model checkpoints alongside your code makes debugging much easier down the road. Once the build stage is complete, the focus shifts to real-time monitoring during test execution.
Tracking Tests During Execution
During testing, monitoring happens in real-time through SDKs, wrappers, or custom AI libraries designed to work with frameworks like Selenium or Cypress. These tools intercept the testing process to monitor self-healing actions and semantic accuracy. For example, in a 2026 benchmark, TestSprite boosted test pass rates from 42% to 93% after just one iteration. Pay extra attention to latency metrics – slow response times from AI models can disrupt time-sensitive gates in your CI/CD pipeline. To handle flaky tests, set up automatic reruns for failures; if a rerun passes, it’s likely a test fluke rather than a genuine issue.
Monitoring After Deployment
Even after tests are complete, monitoring doesn’t stop. In production, tools like Datadog, Prometheus, and New Relic analyze logs and metrics to identify deviations or performance issues that might have slipped through QA. Running synthetic tests against live endpoints ensures that AI-based automation continues to function as expected in the real world. Canary deployments are another smart approach – start by routing 5% of traffic to the new version, giving you a chance to catch problems before they affect a wider audience.
As Bowen Chen of Datadog points out:
"Flaky tests reduce developer productivity and negatively impact engineering teams’ confidence in the reliability of their CI/CD pipelines".
To maintain quality, set up drift detection alerts that compare current metrics – like response relevance and task completion – to established baselines. This helps you catch potential issues early. Also, keep a close eye on token costs alongside error rates; even small tweaks to prompts can lead to unexpected budget spikes.
Creating Dashboards for Real-Time Monitoring
Dashboards wrap up the monitoring process by bringing together data from the build, execution, and post-deployment stages. They transform raw metrics into meaningful insights, making it easier to see if your AI-based tests are hitting the mark. A thoughtfully designed dashboard acts as your control center, offering a clear snapshot of performance.
To make the most of your dashboard, structure it to reflect the different layers of your AI testing process.
Customizing Dashboards for CI/CD Pipelines
Design your dashboard with sections that align with the layers of your AI testing workflow. Group related metrics for better clarity and utility. For instance:
- System health: Track metrics like CPU and memory usage of AI workers.
- Test execution: Include success/failure ratios and average test durations.
- AI quality metrics: Monitor aspects like hallucination detection and confidence scores.
Grafana Cloud simplifies this process with five ready-to-use dashboards tailored for AI observability.
For better efficiency and consistency, use a "Dashboard as Code" approach. Employ the Grafana Foundation SDK to manage and deploy dashboards through GitHub Actions. This method reduces the risk of configuration drift, which often happens with manual updates.
Once your dashboard layout is ready, take it a step further by integrating trend analysis and detailed performance metrics.
Displaying Trends and Performance Metrics
Dashboards that highlight trends can help you catch early signs of performance issues. Keep an eye on key indicators like token consumption, queue depth, and processing latency to spot potential bottlenecks. You can also set up alert thresholds, such as flagging error rates above 0.1 for five minutes or queue backlogs exceeding 100 tasks.
For financial transparency, include real-time spend tracking to display token usage in USD. Additionally, monitor vector database response times and indexing performance to ensure your tests run smoothly and efficiently.
sbb-itb-f6354c6
Setting Up Alerts and Anomaly Detection
Once your dashboards are up and running, the next step is to configure alerts that can flag AI-related issues before they disrupt your CI/CD pipeline. The goal is to strike a balance – alerts should catch genuine problems while avoiding a flood of false alarms. This proactive approach works hand-in-hand with real-time monitoring, keeping your team informed about deviations as they happen.
Setting Thresholds for AI-Based Metrics
Start by establishing baselines that define what "normal" AI behavior looks like. You can use reference prompts or synthetic tests to set these benchmarks. For instance, if more than 5% of responses to predefined prompts deviate from the baseline, it might be time to halt deployments. It’s also helpful to define clear service-level agreements (SLAs) for AI-specific metrics. For example, you could set an 85% success rate threshold for specific prompt categories, like billing queries, and trigger alerts if performance drops below that level.
Cost-based anomaly detection is another useful tool. For example, you might want to flag situations where the cost per successful output jumps by 30% within a week. Make sure your alerts cover both technical metrics (like latency and error rates) and behavioral indicators (like prompt success rates and safety checks). To make troubleshooting easier, tag all logs and metrics with relevant details – model version, dataset hash, configuration parameters, etc. Additionally, keyword monitoring can catch phrases such as "I didn’t understand that", which might signal issues not picked up by traditional uptime checks.
Connecting Alerts to Communication Channels
Once your thresholds are in place, ensure alerts reach the right people. Use tools your team already depends on to route these notifications effectively. For example, pipeline-specific alerts should include metadata like model version, token count, and error traces to help engineers quickly identify the root cause of issues. Custom tags, such as team:ai-engineers, can automatically direct alerts to the correct group while minimizing unnecessary noise for others.
In platforms like Slack, include user IDs (e.g., <@U1234ABCD>) in alert titles to notify on-call engineers promptly. To avoid overwhelming channels with repetitive notifications, consider adding a short delay – about five minutes – between alerts. Beyond chat apps, integrate your alerts with incident management tools like PagerDuty, Jira, or ServiceNow for a more structured workflow. When setting up Slack integrations, test the formatting and frequency of alerts in private channels before rolling them out to broader team channels.
Improving AI Models Using Monitoring Data
Monitoring dashboards and alerts aren’t just for keeping things running – they’re a treasure trove of insights for refining your AI models. The data collected during CI/CD runs can reveal exactly where your test automation falters and what needs fixing. By tracing patterns back to specific model weaknesses, you can address them systematically. These insights become the foundation for retraining strategies, which we’ll touch on later.
Finding Patterns in Test Failures
To start, dig into your historical monitoring data to uncover recurring issues. For instance, analyze the success rate of prompts by category. If billing-related prompts dip below 85% while support prompts remain steady, it’s a clear sign of where your model needs improvement.
Drift detection is another powerful tool. By comparing input and output distributions over time, you can catch "performance drift", where your model’s results degrade after updates or as your application evolves. Netflix employs this method for its recommendation engine, tracking changes in input data distributions. If users start skipping recommended content more often, it’s flagged as a signal to review the model before the user experience takes a hit.
Multi-agent workflows can be particularly tricky. Visualizing decision trees and agent handoffs can help you pinpoint failures like infinite loops, stalled agents, or circular handoffs. Monitoring the number of steps agents take can also reveal inefficiencies. If tasks are taking longer than expected, it might be time to refine your system instructions.
Another effective strategy is comparing current test outputs to your "golden datasets" or previous benchmarks. This allows you to spot deviations before they impact production. Tagging telemetry data with metadata – like model version, token count, or specific tools used – helps you correlate failures with particular changes. For instance, you might trace a spike in response time from 1.2 to 4 seconds back to a recent model update. These identified patterns can then feed directly into the retraining process.
Retraining AI Models for Better Results
Once you’ve identified patterns, retraining your model becomes a targeted effort. Automated workflows can be set up to trigger retraining cycles whenever data drift or accuracy thresholds are breached. LinkedIn’s "AlerTiger" tool is a great example of this in action. It monitors features like "People You May Know", using deep learning to detect anomalies in feature values or prediction scores. When issues arise, it sends alerts to engineers for further investigation.
Instead of relying solely on aggregate metrics, monitor performance across data slices – such as geographic regions, user demographics, or specific test categories. This approach helps you spot localized biases or failures that might otherwise go unnoticed. In cases where ground truth labels are delayed, data drift and concept drift can serve as early warning signals.
Human-in-the-loop workflows are invaluable for obtaining high-quality ground truth labels. Before feeding feature-engineered data into retraining, ensure it meets quality standards by writing unit tests. For example, normalized Z-scores should fall within expected ranges to avoid the "garbage in, garbage out" problem.
When deploying retrained models, start with canary deployments. This involves routing a small percentage of traffic to the new model and monitoring for anomalies before rolling it out more broadly. Nubank, for instance, uses this approach with its credit risk and fraud detection models. By continuously tracking data drift and performance metrics, they can quickly identify when market changes require model adjustments.
Common Problems and How to Fix Them
Dealing with AI-based test automation introduces hurdles that traditional systems never had to face. One of the biggest headaches? Alert fatigue. AI systems generate massive logs, and if thresholds aren’t fine-tuned, teams can quickly get buried under a mountain of false or low-priority alerts. Another tricky issue is non-deterministic behavior. Unlike traditional code, AI systems might give different results for the same input, making it tough to pin down what "normal" even means.
On top of that, complex data pipelines can hide the real cause of failures. If something goes wrong early – like during data ingestion or preprocessing – it can ripple through the entire pipeline, making troubleshooting a nightmare. Add multi-agent workflows to the mix, and things get even messier. Agents can get stuck in infinite loops or fail during handoffs. Let’s dive into some practical fixes for these challenges.
Fixing Incomplete Metric Coverage
When your metrics don’t cover everything, you risk missing behavioral failures like hallucinations or biased responses. The solution? Build observability into the system from the start instead of tacking it on later.
Start small. Use pilot modules – manageable workflows where you can test AI-based monitoring in a controlled setting. For example, if you’re monitoring a chatbot, focus on one specific conversation flow before scaling up to cover all interactions.
To close coverage gaps, use reference prompts and tag telemetry with details like model version, token count, and tool configurations. Tools like OpenTelemetry can help ensure your metrics, logs, and traces remain compatible across different monitoring systems. Once you’ve nailed down comprehensive coverage, fine-tune your alert protocols to avoid unnecessary disruptions.
Reducing False Positives in Alerts
False positives can drain your team’s energy and waste precious time. Worse, when alerts come too often, there’s a risk people start ignoring them – even the critical ones. David Girvin from Sumo Logic puts it perfectly:
"False positives are a tax: on time, on morale, on MTTR, on your ability to notice the one alert that actually matters."
A phased rollout can help. Start with a monitor-only phase, where the AI scores alerts but doesn’t trigger automated responses. This lets you compare the AI’s findings with manual investigations, ensuring the system’s accuracy before fully automating it. Teams using this approach have reported dramatic drops in false positives.
To cut down on noise, implement dynamic thresholds based on historical trends instead of fixed numbers. Configure alerts to trigger only when metrics deviate significantly from the norm. Build a feedback loop to refine alert accuracy over time. You can also use whitelists for known-good events, which helps reduce unnecessary alerts and keeps your pipeline running smoothly.
Conclusion
Keeping a close eye on AI-driven test automation isn’t just a nice-to-have – it’s what separates a CI/CD pipeline that consistently delivers quality from one that prioritizes speed at the expense of reliability. Traditional uptime checks often fall short when it comes to identifying the unique issues AI systems can encounter. Things like hallucinations, skipped steps, or runaway API costs might slip right past standard error logs, leaving teams vulnerable to undetected failures.
To tackle these challenges, focus on tracking key metrics like self-healing success rates, building real-time dashboards, and setting up smart alerts. These tools act as a safety net for addressing AI-specific issues. For instance, teams using AI-powered testing platforms have reported an 85% reduction in test maintenance efforts and 10x faster test creation speeds. This shift allows them to channel more energy into innovation instead of getting bogged down by maintenance. As Abbey Charles from mabl aptly put it:
"Speed without quality is just velocity toward failure".
Incorporating monitoring and observability into your CI/CD pipeline from the outset is crucial. Automating behavioral evaluations during the CI phase and defining AI-specific SLAs for metrics like intent accuracy and token efficiency can help ensure your pipeline is not only fast but also dependable.
With 81% of development teams now leveraging AI testing, the real question is: can you afford to fall behind?
FAQs
What metrics should you monitor for AI-based test automation in CI/CD pipelines?
To make AI-driven test automation effective within your CI/CD pipeline, you need to keep an eye on both general test automation metrics and those specific to AI.
For test automation, key metrics include:
- Test-case pass rate: The percentage of test cases that pass successfully.
- Test coverage: How much of your application is covered by automated tests.
- Average execution time per build: The time it takes to run tests for each build.
- Flakiness: The rate of inconsistent test failures.
- Defect-detection efficiency: The proportion of bugs caught by automated tests compared to those discovered in production.
When it comes to the AI component, focus on:
- Model inference latency: The time the AI model takes to make predictions.
- Prediction accuracy (or error rate): How often the AI model’s predictions are correct.
- Drift detection: Monitoring how much the AI model’s performance deviates from its training data.
- Resource usage per test run: The computing resources consumed during testing.
On top of these, it’s crucial to track broader CI/CD pipeline metrics like:
- Deployment frequency: How often new updates are deployed.
- Mean time to recovery (MTTR): The average time it takes to recover from failures.
- Change-failure rate: The percentage of changes that result in failures.
By correlating these pipeline metrics with both test automation and AI-specific data, you can gain a well-rounded understanding of your system’s reliability, speed, and overall efficiency.
How can I set up alerts to monitor AI issues in my CI/CD pipeline?
To keep a close eye on AI-related issues in your CI/CD pipeline, start by focusing on key metrics. These include factors like inference latency, accuracy, drift percentage, and resource usage (such as CPU/GPU consumption). These metrics provide a clear picture of your AI models’ performance and overall health.
Once you’ve identified the metrics, configure your pipeline to log and report them in real-time. You can use tools like tracing or custom metric calls to achieve this. It’s also essential to set up alerts tied to specific thresholds. For instance, you might trigger an alert if latency exceeds 2 seconds or if drift goes beyond 5%. Make sure these alerts are integrated with your incident-response channels – whether that’s Slack, email, or PagerDuty – so your team gets notified the moment something unusual happens.
Don’t forget to test your alert system. Simulate failures in a sandbox environment to ensure everything works as expected. As you gain more insights, fine-tune your thresholds to reduce the chances of false positives. Finally, document your alert policies and processes thoroughly. This not only ensures consistency but also makes it much easier to onboard new team members.
What are the best ways to monitor AI-driven test automation in a CI/CD pipeline?
To keep an eye on AI-driven test automation in your CI/CD pipeline, you’ll need tools that can handle both standard metrics and AI-specific factors like model drift or response errors. At the source code level, tools such as Agent CI are great for assessing changes in terms of accuracy, safety, and performance before they’re merged.
When you move into the build and testing phases, platforms like Datadog come in handy for tracking latency, failure rates, and custom AI metrics, ensuring everything operates as expected.
For deployment verification, tools like Harness CD use AI-powered test suites to spot anomalies before they hit production. After deployment, monitoring solutions such as Sentry, UptimeRobot, and Azure Monitor help keep tabs on runtime health, catch silent failures, and alert your team about potential problems. By using a mix of these tools, you can maintain dependable AI performance throughout every step of your CI/CD pipeline.