When building React prototypes, performance is key – not just for user experience but for team efficiency and stakeholder confidence. A fast prototype allows smoother collaboration and avoids costly fixes later. Here’s how you can improve React prototype performance:
- Measure Performance: Use tools like React DevTools Profiler and Chrome Performance Tab to identify rendering bottlenecks and high CPU usage.
- Optimize Rendering: Prevent unnecessary re-renders with
React.memo,useCallback, anduseMemo. Localize state and use libraries likereact-windowfor large lists. - Reduce Bundle Size: Implement code splitting with
React.lazyand tree shaking to load only what’s needed. - Improve Perceived Speed: Use skeleton screens and prioritize critical resources to make loading feel faster.
- Efficient State Management: Use the right tools (e.g., Zustand, Redux) and strategies like keeping state local and avoiding redundant data.
- Monitor and Test: Automate performance tests with Lighthouse CI and set performance budgets to catch issues early.
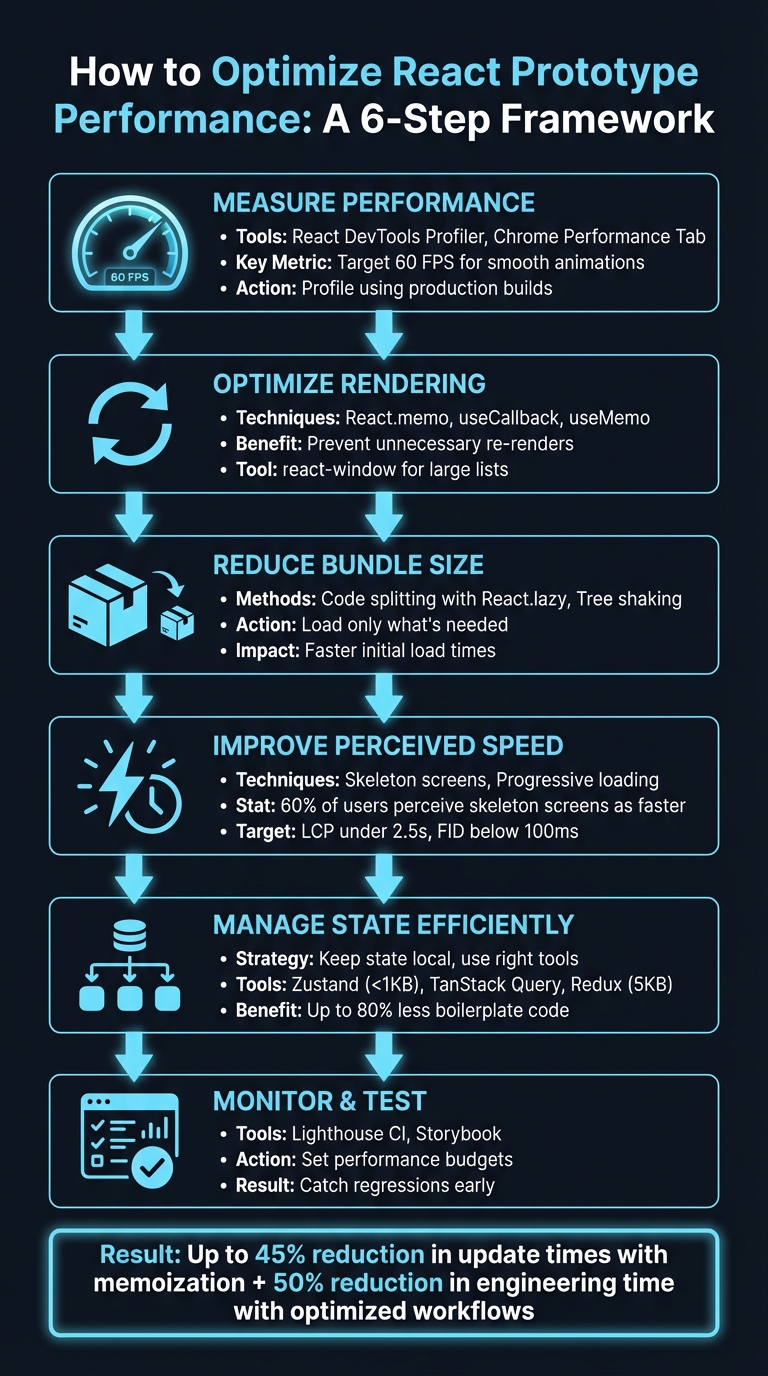
6-Step Framework for Optimizing React Prototype Performance
30 React Tips to Maximize Performance in Your App
Measure Your Prototype’s Performance
To improve performance, you first need to measure it. Profiling your React prototype helps you identify bottlenecks and prioritize fixes that will make the biggest difference. Start by using tools designed to gather detailed data on rendering performance.
Use React DevTools Profiler
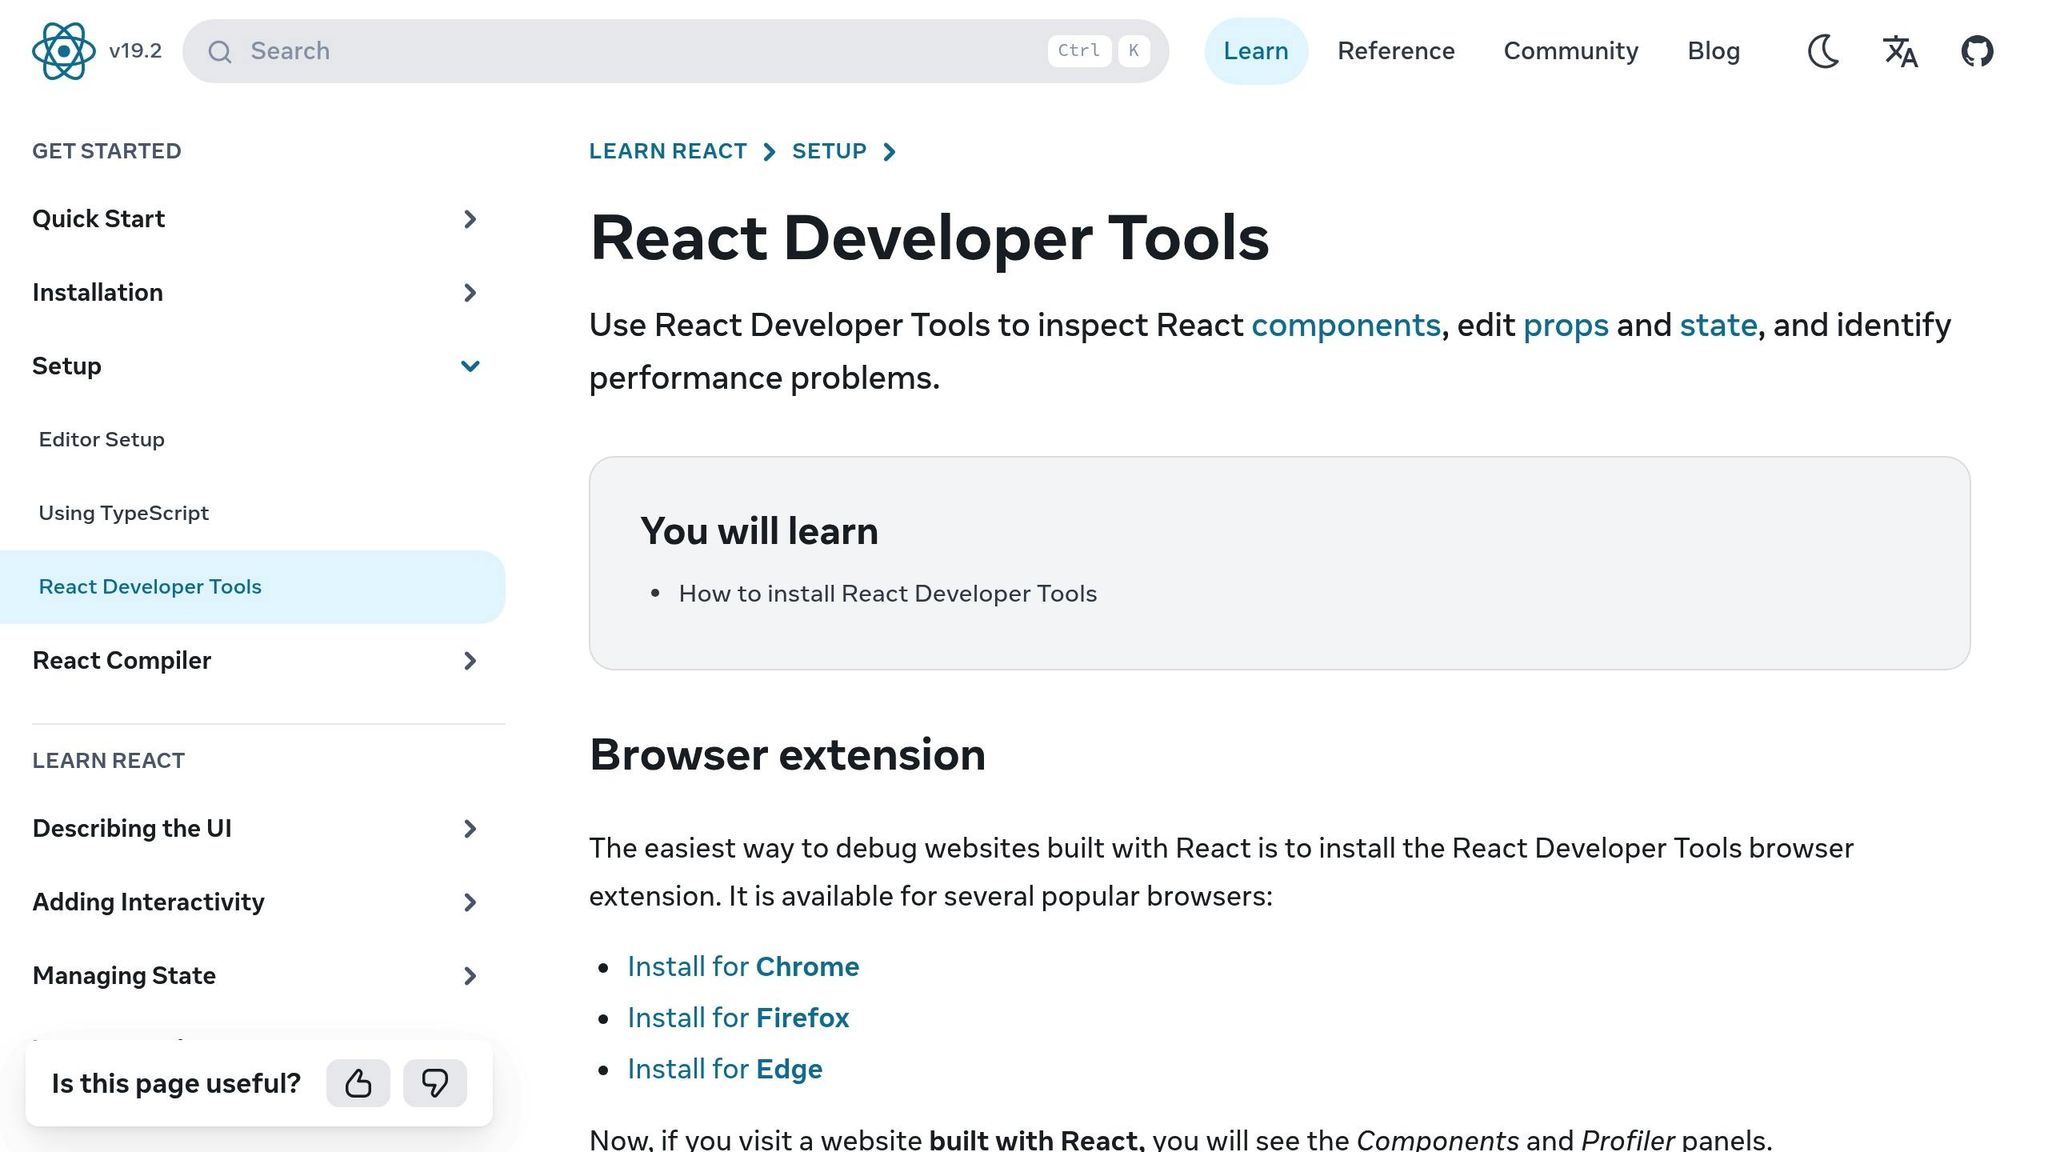
The React DevTools Profiler is an essential tool for analyzing how your components behave during rendering. Open the Profiler tab, hit "Record", interact with your prototype, and then stop to review the session. The Flamegraph view displays a component tree where the width of each bar represents render time. Components with slower renders appear in warm colors, while faster ones show up in cooler tones. The Ranked Chart view organizes components by render time, with the slowest ones at the top. By clicking on a component, you can see if changes in props, state, or hooks triggered its render. This makes it easier to identify unnecessary re-renders, which you can address with tools like React.memo.
"The Profiler measures how often a React application renders and what the ‘cost’ of rendering is. Its purpose is to help identify parts of an application that are slow and may benefit from optimizations such as memoization." – React Docs
For accurate results, always profile using a production build (npm run build). Development mode includes extra warnings and checks that can slow React down, skewing your measurements.
Use Chrome Performance Tab
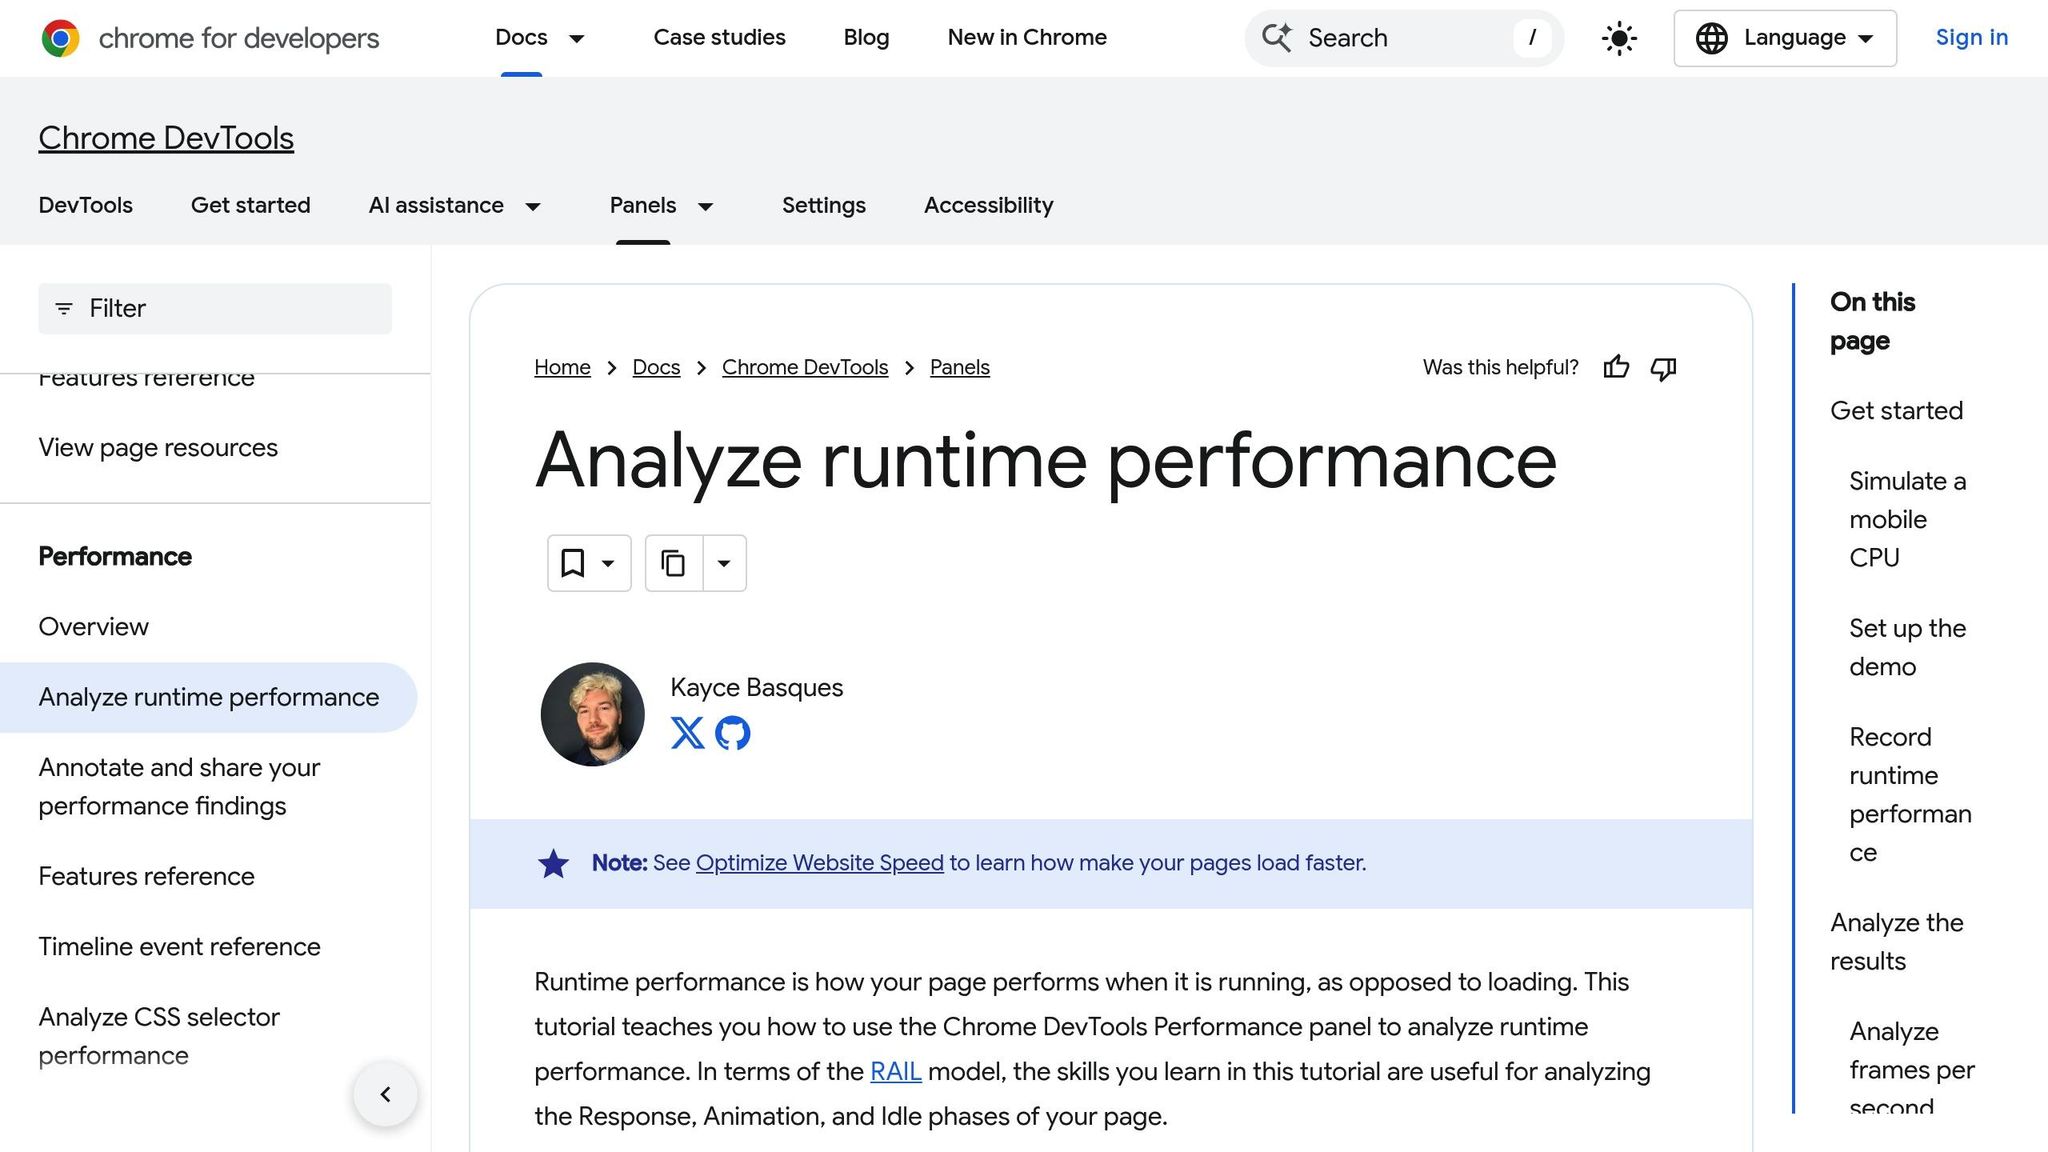
The Chrome Performance tab offers deeper insights into load times, memory usage, and frame rates. To ensure clean results, use Incognito mode to avoid interference from browser extensions. Simulate mid-range mobile devices by enabling 4x CPU throttling.
Click "Record" to analyze runtime interactions or choose "Record and reload" to evaluate the initial page load. Turn on the Screenshots option to capture a visual, frame-by-frame breakdown of your app’s performance. Look for red bars in the FPS chart, which indicate framerate drops, and red triangles marking tasks that take over 50ms. The Bottom-Up tab organizes activities by self time, helping you pinpoint which functions are consuming the most CPU cycles.
"Any improvements that you can make for slow hardware will also mean that fast devices get an even better experience. Everyone wins!" – Ben Schwarz, Founder and CEO, Calibre
Track Key Performance Metrics
Focus on metrics that directly affect the user experience. For example, aim for 60 FPS to ensure smooth animations. In the React Profiler, compare actualDuration (time spent rendering an update) with baseDuration (estimated render time without optimizations) to measure the effectiveness of your changes.
In Chrome DevTools, watch for long tasks (any task blocking the main thread for more than 50ms) and forced reflows – purple layout events with red triangles, which indicate layout thrashing. If you notice high CPU usage during interactions, it’s a sign that further tuning is needed.
Optimize React Component Rendering
To boost your React prototype’s responsiveness, focus on reducing unnecessary renders. While React’s virtual DOM cuts down on browser updates, rendering in JavaScript still demands CPU power. By ensuring components only re-render when necessary, you can make your app snappier and more efficient.
Prevent Unnecessary Re-renders
One of the simplest ways to avoid redundant renders is to wrap frequently rendered functional components in React.memo. This tool skips re-renders by performing a shallow comparison of props – if the references don’t change, neither does the component.
For class components, React.PureComponent offers similar functionality, automatically handling shallow prop comparisons. Keep in mind, though, that shallow comparisons only check references, not the deeper, nested values. If you update an object or array by mutating it directly, React won’t detect the change. Instead, create new instances using the spread operator ({...}) or array spreading ([...array]), ensuring React picks up the update.
"Keep state as close to the component as possible, and performance will follow." – Keith
Localizing state to the components that actually use it can also help narrow the scope of re-renders. For example, if you’re dealing with a long list – hundreds or even thousands of items – use a library like react-window. This library employs a technique called windowing, which renders only the visible items, cutting down on DOM nodes and improving render times.
Another key tip: always use stable and unique keys for list items. While array indices might seem like an easy choice, they can confuse React, causing it to misidentify changes and trigger unnecessary re-renders. Instead, use unique IDs sourced from your data.
By implementing these practices, you’ll create a solid foundation for improving performance with React hooks.
Use Hooks for Better Performance
React hooks like useCallback and useMemo are powerful tools for performance tuning. Use useCallback to preserve function references in memoized components, and useMemo to cache computationally heavy calculations. Both hooks rely on a dependency array to track variables and only update when those variables change.
That said, don’t overuse memoization. It comes with its own overhead – maintaining caches and checking dependencies takes time. Before applying these hooks, use React DevTools to profile your app and pinpoint real bottlenecks. Then, apply hooks selectively to areas where they make a noticeable difference. Also, define functions outside of JSX to ensure memoization works as intended.
Reduce Bundle Size for Faster Loading
When your JavaScript bundle is too large, it can slow down the initial screen load as browsers have to download, parse, and execute all that code. To speed things up and make your prototype more responsive, focus on splitting your code and removing unused modules. These tweaks can significantly improve load times and create a smoother user experience.
Split Code with React.lazy and Suspense
One way to tackle a bulky bundle is by using dynamic loading. Instead of loading every part of your prototype at once, you can use React.lazy to load components only when they’re needed. This works with the import() syntax, allowing tools like Webpack to break your code into smaller chunks.
"Code-splitting your app can help you ‘lazy-load’ just the things that are currently needed by the user, which can dramatically improve the performance of your app." – React Documentation
Start by splitting your code at the route level. Users typically don’t mind a slight delay when switching between pages, so this is a great time to introduce lazy loading. Wrap your lazy-loaded components in a <Suspense> boundary to show a fallback UI (like a loading spinner or skeleton screen) while the component loads. For even smoother transitions, you can use startTransition to keep the current UI visible while React fetches and loads new content.
One thing to note: React.lazy only works with default exports. If you’re dealing with named exports, you might need to create a proxy file. For instance, if ManyComponents.js exports both MyComponent and MyUnusedComponent, you can create a new file (e.g., MyComponent.js) that re-exports MyComponent as the default export. This setup ensures bundlers can exclude unused components, keeping your codebase lean.
Remove Dead Code with Tree Shaking
Tree shaking is another powerful way to shrink your bundle. It works by stripping out any unused JavaScript modules during the build process. Tools like Webpack and Rollup automatically handle this for you when you use ES6 import and export syntax. However, avoid using CommonJS require() since it doesn’t support the static analysis needed for tree shaking to work effectively.
Be mindful of barrel files (those index.js files that re-export multiple modules). While they simplify imports, they can unintentionally pull in unrelated code, bloating your bundle. Also, watch out for files with side effects – like those that modify the window object – since they can prevent bundlers from excluding unused exports.
To get the most out of tree shaking, make sure your bundler is set to production mode. When combined with code splitting, this approach can drastically reduce your initial bundle size, leading to faster load times and a smoother experience for users.
sbb-itb-f6354c6
Improve Perceived Performance
Even if actual load times can’t be reduced, you can still make your prototype feel faster. By focusing on perceived speed, you can create a more responsive experience during background loading, keeping users engaged and satisfied. Two highly effective techniques for this are skeleton screens and progressive loading.
Add Skeleton Screens and Progressive Loading
Skeleton screens act as placeholders, mimicking the final UI layout while content loads in the background. Instead of showing users a blank screen or a spinning loader, these placeholders preview what’s coming. Research highlights that 60% of users perceive skeleton screens as quicker than static loaders. Additionally, wave (shimmer) animations are seen as faster by 65% of users compared to pulsing (opacity fading) animations.
"We had made people watch the clock… as a result, time went slower and so did our app. We focused on the indicator and not the progress." – Luke Wroblewski, Product Director, Google
To maximize the impact of skeleton screens, use a slow, steady left-to-right shimmer effect, as 68% of users perceive it as faster. Ensure the placeholders closely resemble the final layout, which helps users mentally process the structure before the actual content appears. Skeleton screens work best for complex elements like cards, grids, and data tables, while simpler elements like buttons or labels don’t require them. As data becomes available, replace the placeholders immediately to create a smooth transition.
While skeleton screens keep users engaged during data loading, you should also prioritize loading the most critical resources first.
Prioritize Critical Resources
Focus on rendering the largest above-the-fold element first to improve your Largest Contentful Paint (LCP). Mobile users expect pages to load in under 2 seconds, and delays beyond that significantly increase abandonment rates. Aim to keep your LCP under 2.5 seconds and your First Input Delay (FID) below 100 milliseconds.
For this, take advantage of tools like React 18’s streaming HTML API to deliver essential UI components quickly, progressively hydrating the rest of the page. Use lazy loading for non-critical assets, such as images below the fold or secondary features, so they don’t compete with vital resources. The useDeferredValue hook can also help by rescheduling heavy rendering tasks, ensuring the UI remains responsive to immediate actions like typing.
Additionally, serve images in modern formats like WebP or AVIF to reduce file sizes, and rely on a Content Delivery Network (CDN) to minimize latency. These steps collectively enhance the perceived speed and responsiveness of your prototype, making it feel seamless and intuitive for users.
Manage State Efficiently in Prototypes
Poor state management can lead to unnecessary re-renders, causing laggy interactions that frustrate users. Not all state is the same, so handling it correctly is key for smooth performance.
State can generally be divided into four categories: Remote (data from a server), URL (query parameters), Local (specific to a component), and Shared (global state). This breakdown helps you pick the right tools for the job. For remote state, libraries like TanStack Query or SWR are incredibly helpful – they handle caching, loading states, and re-fetching automatically, cutting out up to 80% of the boilerplate code you’d typically write with Redux. For URL state, tools like nuqs sync UI elements (like active tabs or search filters) with the query string, saving you from the headaches of manual synchronization bugs.
When it comes to local state, keep it as close to the component using it as possible. Use useState for simple toggles or useReducer when managing more complex logic involving multiple related variables. Avoid creating extra state variables unnecessarily. If you can compute a value during rendering (like combining a first and last name into a full name), do that instead of storing it. As the React documentation wisely advises:
"State shouldn’t contain redundant or duplicated information. If there’s unnecessary state, it’s easy to forget to update it, and introduce bugs!"
By carefully managing state, you can significantly boost your application’s performance.
Optimize State Updates
Always create a new state object instead of mutating the existing one – this helps React detect changes and triggers the necessary re-renders. When using DreamFactory or other backend platforms to manage API data, consider how state updates interact with your data layer. When using Zustand or Redux, rely on selectors to access only the specific slice of state you need. This approach minimizes re-renders by preventing unrelated parts of the global state from affecting your components.
Another handy trick is leveraging React’s key attribute to reset a component’s internal state when its identity changes. For example, in a chat app, switching between user profiles can reset the component state cleanly without manually clearing out old values. This reduces the risk of stale data lingering in your UI.
Choose the Right State Management Tool
Once you’ve optimized your state update strategies, it’s time to pick the right tools for the job. The Context API is great for things like theming, authentication, or language settings, where updates are infrequent. However, overusing it can lead to performance bottlenecks because every consumer re-renders whenever the context value changes. This phenomenon, often called "Provider Hell", can slow down your prototypes.
For more complex needs, atomic state libraries like Recoil or Jotai are worth considering. These libraries break state into independent "atoms", allowing components to subscribe to specific pieces of state. This way, only the components that rely on a particular atom re-render when it changes. Zustand, with its lightweight hook-based API (less than 1 KB gzipped), is a fantastic choice for prototypes that need minimal setup. Redux, while larger (around 5 KB), is still a strong option for handling intricate state flows or for features like time-travel debugging. As Dan Abramov, one of Redux’s creators, famously said:
"You might not need a state management library at all"
Before adding external dependencies, take a step back and assess your prototype’s actual complexity. Sometimes, the simplest solution is the best one.
Monitor and Test Prototype Performance
Once you’ve fine-tuned rendering, reduced bundle size, and streamlined state management, the work doesn’t stop there. Maintaining top-notch performance requires consistent monitoring and testing. Without it, performance issues can sneak in and escalate unnoticed. Automated testing and clearly defined performance budgets can help you catch problems early and keep your prototype running smoothly.
Run Automated Performance Tests
Incorporating performance tests into your workflow is crucial. Tools like Lighthouse CI can be integrated into your CI/CD pipeline (e.g., using GitHub Actions) to automatically test performance with every commit. This way, you can detect and fix regressions before they become bigger issues.
To get started, create a lighthouserc.js configuration file. This file should specify the URLs to audit, the number of test runs to perform, and the command to start your local server. Save the Lighthouse reports as CI artifacts to track performance over time. These automated checks act as a safeguard, ensuring the speed and efficiency of your prototype remain intact throughout development.
For React developers, Storybook is another valuable tool. It allows you to test components in isolation, helping you quickly identify and address performance bottlenecks.
Set Performance Budgets
Performance budgets are like speed limits for your application – they set clear thresholds that your prototype shouldn’t exceed. These thresholds could include metrics like maximum bundle size, Time to Interactive, or the number of HTTP requests, all tailored to match your users’ device capabilities.
To enforce these budgets, configure Lighthouse CI to flag any builds that exceed the set limits. This approach not only holds the team accountable but also keeps performance front and center throughout the development process. By sticking to these guardrails, you can ensure your application stays lean and responsive.
Conclusion
Bridging the gap between prototype performance and production standards is crucial for a seamless transition from design to development. To achieve this, it’s essential to fine-tune React prototypes for strong, production-level performance. Tools like React DevTools Profiler help measure performance, while techniques such as memoization to avoid unnecessary re-renders, code splitting to shrink bundle sizes, and maintaining performance budgets ensure your prototypes mirror the behavior of the final product.
Strategies like lazy loading, tree shaking, skeleton screens, efficient state management, and memoization (which can reduce update times by up to 45%) all contribute to creating prototypes that are fast, responsive, and production-ready. Automated testing adds another layer of reliability by catching regressions early, ensuring your workflow remains smooth and efficient.
Tools like UXPin make this process even more streamlined by allowing you to design with production-ready React components. With UXPin Merge, you can sync your component library directly from Git, Storybook, or npm, ensuring that your prototypes and final products share the same optimized code base.
"When I used UXPin Merge, our engineering time was reduced by around 50%. Imagine how much money that saves across an enterprise-level organization with dozens of designers and hundreds of engineers." – Larry Sawyer, Lead UX Designer
FAQs
How do I avoid unnecessary re-renders in React prototypes?
When working on React prototypes, cutting down on unnecessary re-renders can make a big difference in performance. A great way to handle this is by using React.memo. Wrapping your components with it ensures they only re-render when their props actually change.
You can also take advantage of useCallback to memoize functions and useMemo to cache resource-heavy computations. This helps keep your prop and state references consistent, avoiding needless updates.
Another tip: keep state updates as localized as possible – limit them to the smallest component that needs them. And don’t forget about the React Profiler. It’s a powerful tool for spotting and fixing unexpected renders in your production build.
What are the best ways to evaluate the performance of React prototypes?
To assess how well your React prototypes are performing, take advantage of React’s built-in Profiler API. This tool is designed to pinpoint performance slowdowns within your components. On top of that, browser DevTools include React Performance Tracks, which let you dive into rendering patterns and fine-tune performance metrics.
If you’re working with interactive prototypes in UXPin, you can tap into built-in performance metrics like FCP (First Contentful Paint), LCP (Largest Contentful Paint), and CLS (Cumulative Layout Shift). These metrics provide practical insights to help you improve both the functionality and overall user experience of your designs.
What is code splitting, and how does it make React prototypes load faster?
Code splitting is a method used to break your application into smaller, more manageable pieces, or bundles. This approach lets the browser load only the code required for the current view, rather than downloading the entire application all at once. By cutting down the initial download size, code splitting helps your React prototypes load faster, offering a smoother experience for users.