In this article, we explain the general product design process and relevant documents you might produce at the first three of seven stages. It is meant to be a flexible framework as opposed to a strict recipe. These ideas are covered in greater detail across 150+ pages in the Guide to UX Design Process & Documentation e-book.
The following is an overview of product design and development documentation, constituent elements, and the respective phases to which they belong. The development process and resulting documents can vary widely between companies, as many follow their own unique design and development principles/methodology. In general, however, many of the deliverables below are common within most organizations in some form—including my wireframing and prototyping company, UXPin.
How They All Relate
Prior to elaborating on each constituent document, it may be helpful to take a cursory look at them from a bird’s eye perspective, in the context of the entire product design and development process:
1. During the initial phase of product definition, you’re brainstorming the product and how to execute on the project at the highest level with all necessary stakeholders. This might result in project kickoff plan, a lean canvas, and a bunch of really early sketches of what you’re trying to build.
2. Moving into research, your team needs to refine your assumptions and fill in blanks. This stage varies based on the complexity of the product, timing, resources, level of existing knowledge, and many other factors. In general, however, it’s good to build out competitive and market analyses and conduct customer surveys. If you have an existing product, reviewing analytics, heuristics, content, product context, and user tests are also really helpful.
3. In analysis, the product marketing data collected thus far is used as the groundwork for generating personas, experience maps, and requirements-related documents such as prioritized requirements lists and user-task matrices. At this point, the product definition, product priorities, and product plan has been defined and are ready for more formal design deliverables although sketches and diagrams are likely constantly being generated throughout this time.
4. From this output, scenarios, concept maps, and mockups may be created, leading into the design phase—whereupon activities such as conceptualization through sketches, wireframes, lo-fidelity, and hi-fidelity prototype creation, and design element specifications through task-flow diagrams, guidelines, and assets creation are undertaken. For example, competitive analysis and personas created during research and analysis are instrumental at this stage for building mockups, concept maps, and scenarios. In turn, these items provide the impetus for creating intermediate and advanced stage design outputs such as wireframes, storyboards, and detailed mockups.
5. During implementation, code and design assets are assembled to create a product that adheres to the previously established product design specifications.
6. Upon launch of the live product, feedback data such as trouble/support tickets, bug reports, and other analytics will continue to drive product development and refinement through subsequent iterations, upgrades, and projects. With the offering in production mode, data should be continually generated and monitored in the form of analytics and reports to ensure the continued success of the product.
7. Continual, data-driven product improvement can be achieved through measuring and iterating the offering in production, using performance dashboards and analytics.
1. Product Definition
Initial activities such as stakeholder’s kickoff meeting, brainstorming, and rudimentary product sketching lead to the creation of the following outputs:
- Project Kickoff Plan — a high-level outline of the product purpose, who is involved in designing and developing a product, how they’ll work together and stay up-to-date on the progress, and what the intended results or success metrics are. This document is becoming shorter and shorter as teams become more nimble and projects more lean, and can be presented in a powerpoint, document, wiki, or project management software.
- Lean Canvas — an actionable blueprint for product and market development, adapted from the business model canvas. It overlaps a lot with a project kickoff plan in defining the key problems it’s solving, customer segments, it’s unique offering, details of the solution, key metrics, and so forth. However, the Lean Canvas is more strategic while the Project Kickoff Plan is more tactical so they’re complementary to some degree (instructions here).
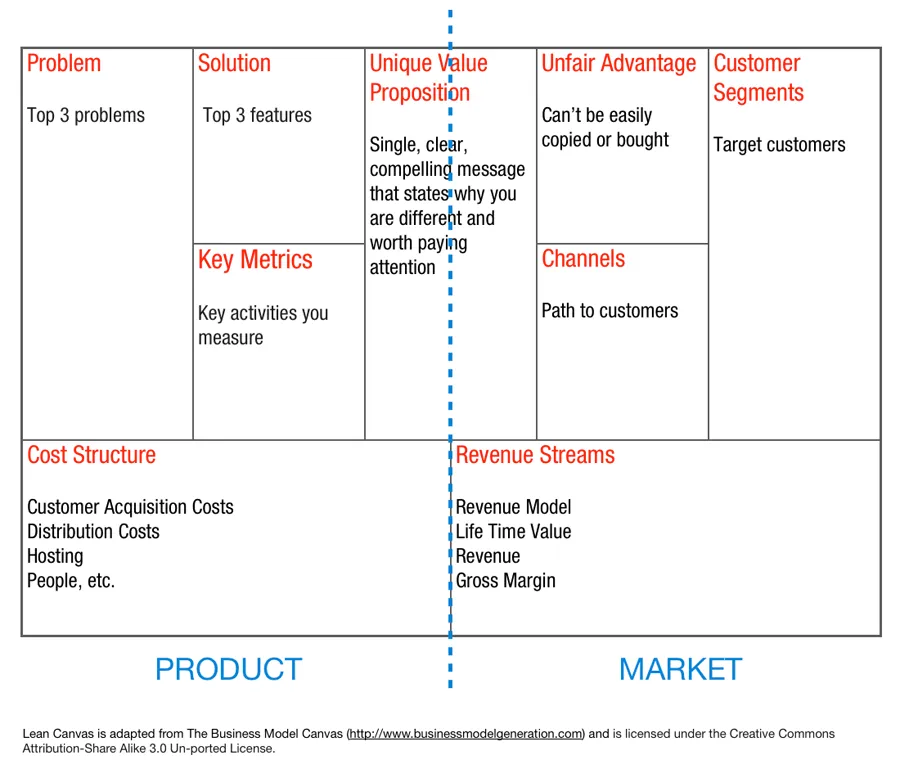
Source: Why Lean Canvas
2. Research
Market conditions are assessed, such as the identification of current solutions on the market and their successes/failures. This competitive analysis and resulting market analysis help to determine product positioning and direct/indirect competition. Additionally, potential customers can be interviewed to gather data about their product preferences.
As discussed in our Guide to UX Design Process & Documentation e-book, the following documents are created through these activities:
- Competitive Array — a matrix rating each competitor based on a particular weighted success factors, resulting in an overall ranking of the competition. This can be generated from Google Research, Crunchbase profiles, competitor classifications, drill-downs of competitor’s online properties, and executive interviews among other activities.
- SWOT Analysis — short for Strengths, Weaknesses, Opportunities, and Threats, this analysis measures internal and external factors for assessing the product’s position in the competitive environment. You can use a lot of the same sources for creating the Competitive Array in addition to focus groups, statistical surveys, and other qualitative and quantitative research.
- Competitor Profiles or Landscape Summary — analysis that identifies the competitors and how the product or solution to be built can compete and/or improve upon their offerings. Generally speaking, it breaks down key points about their background, financials, products, marketing, facilities, personnel, and corporate and marketing strategies.
- Market Segmentation List — document dividing potential customers and users into specific buckets based on their specific, shared needs and characteristics. Generally speaking, they’re segmented by geography, demographic, behaviors, psychology, benefits or some combination of the aforementioned (instructions here).
- Survey Results — data gathered from surveys about potential users, customers, competitors or specific products, identifying user or customer needs/concerns, validating or disproving assumptions, and providing recommended solutions to properly address the market (best practice tips here).
- Growth-Share Matrix — a chart that plots competitor’s market share against the market’s growth rate (instructions here).
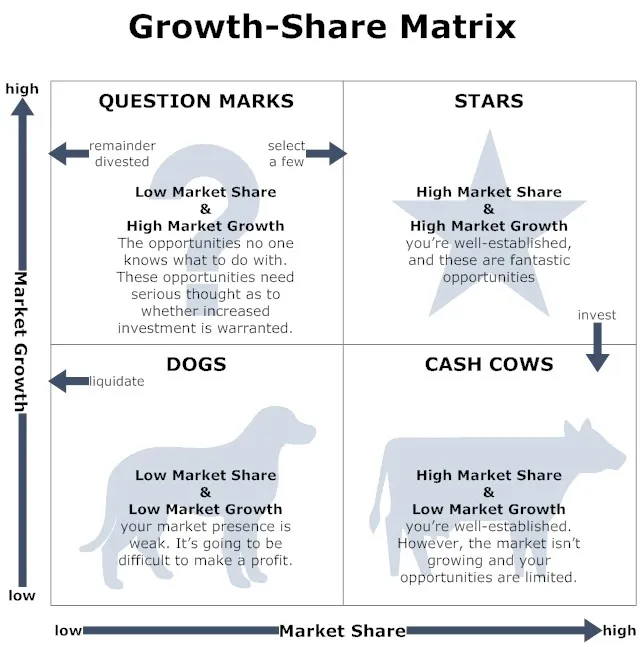
Source: Growth Share Matrix
The following require a pre-existing product — or at least a prototype:
- Heuristic Evaluations — a qualitative analysis of the existing product generated in an excel report.
- Usability Report — summarizes the ease of use of a product, feature or set of features (best practice tips here).
- Analytics Report — a quantitative analysis of the existing product using all accessible data available internally, broken out into findings, assumptions, and recommendations. For SaaS products specifically, tools like Baremetrics can streamline this process by providing comprehensive subscription analytics and metrics dashboards that track key performance indicators like MRR, churn, and revenue trends across your user base (sample analytics dashboards here).
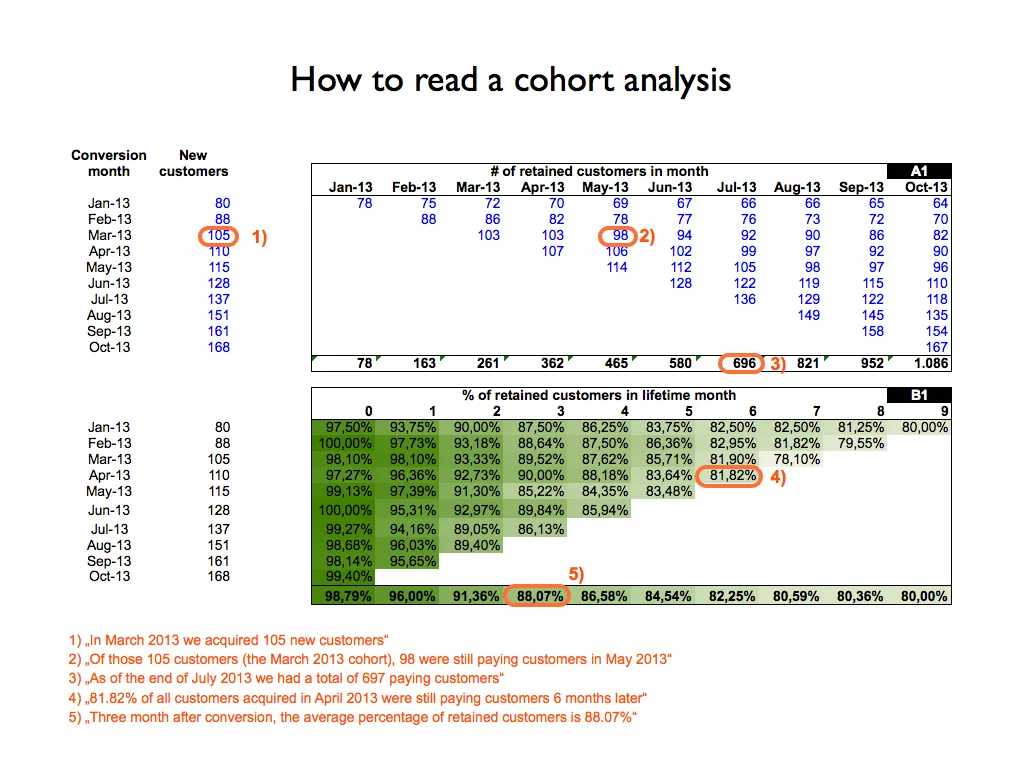
Source: The Easiest Spreadsheet for Churn MRR and Cohort Analysis
3. Analysis
With an understanding of how the potential product may address customer needs (and how it may fit into the current market space) user-centric modeling ensues. Emphasis is placed on understanding and profiling the user through the following outputs:
- Personas — clusters of users grouped by common behavioral patterns and characteristics, with data derived from research and interviews. Resulting documents and/or reports detail touchpoints each persona has with the product (instructions here).
- Scenarios or Use Cases — generated through brainstorming with existing data and interviews, this describes “a day in the life” of a persona and probably includes how your website or app fits into their lives by mapping out touchpoints and reactions to the product. The report may even contain visual storytelling. (instructions here).
- Experience Map — detailing the user’s experience across various situations and use cases.
- Prioritized Requirements Document — business and user requirements are detailed, coalesced and prioritized to have the highest impact with the lowest effort in the shortest amount of time.
- User-Content Matrix — identifying content types, sources, and disposition as they relate to the user.
- User-Task Matrix — charting user tasks to frequency of use per user.
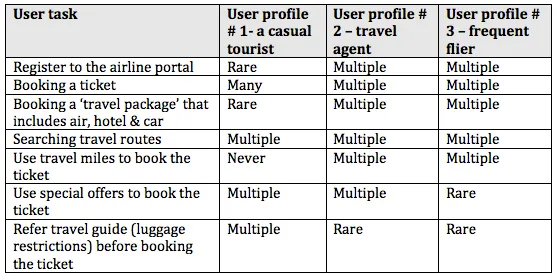
Source: User Task Matrix
Conclusion
In short, from inception to launch, the outputs produced in each phase of product development function as building blocks for the activities that follow.
Product design and development documentation not only provide a means to encapsulate, organize, and share information arising out of each stage of development but also preserves a product’s development history for posterity. This can ultimately enable a firm or company to improve their processes and reproduce past product successes, allowing them to reach a greater level of agility and competitiveness.
For additional analysis, check out the 150+ page Guide to UX Design Process & Documentation e-book. Expert advice is featured from Aarron Walter, Laura Klein, Ian McAllister, and dozens of others. Visual examples are also shown from companies like Vurb, MailChimp, Apple, Google, and many more.