When I first started working with my client (love coach Kavita J Patel), we could barely keep up with the never-ending site changes. It seemed like we were on the whim of her demands.
Back then, I didn’t realize she wasn’t sure of her own strategy or even who exactly the user was.
I started to ask questions such as “Why” and “So what?” and found that she had no good answer. A lot of the decisions were knee-jerk reactions and based on feeling. Not surprising for most UX projects.
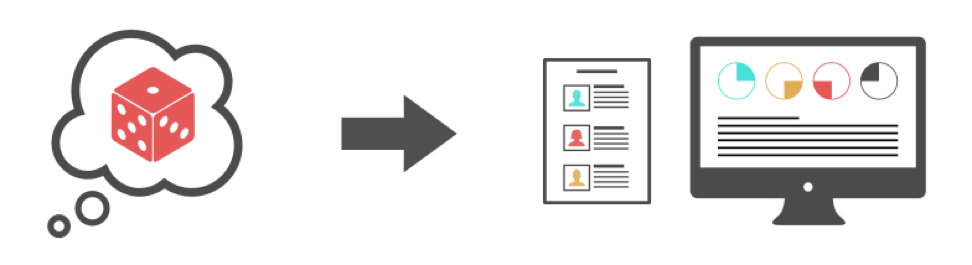
Of course, we needed to understand (or at least recognize) the user before we could start a meaningful discussion about strategy. We needed more data to make more informed decisions.
Two big problems appeared (as they always do): limited time & budget. We couldn’t afford to follow the standard user research process – or even half of that.
We had to improvise.
If you’re working with a client or company with tight budgets and timelines, I’ll provide some practical tips based on my own experience as a UX consultant. We’ll explore tactics that offer the most insights for the money and time required.
1. Write out your assumptions
To get started, first write down the assumptions about the user. This will help the whole team start to identify gaps in understanding.
For example, we quickly unpacked the following assumptions for my client:
- Women in their 30’s
- Looking for love
- Have tried various things to find love, but they don’t work
- Believe that love is possible but distant
- Pretty tech savvy and need mobile access for all content
- Go on at least one date a week
2. Run a Survey
To start making better decisions as soon as possible, you can start by testing the most basic assumptions in a survey.
Create the survey
Keep it as short as possible. Shorter surveys that require less than 3 minutes to complete get more responses.
Limit the number of open-ended questions. Don’t forget that you still need to make sense of all that data.
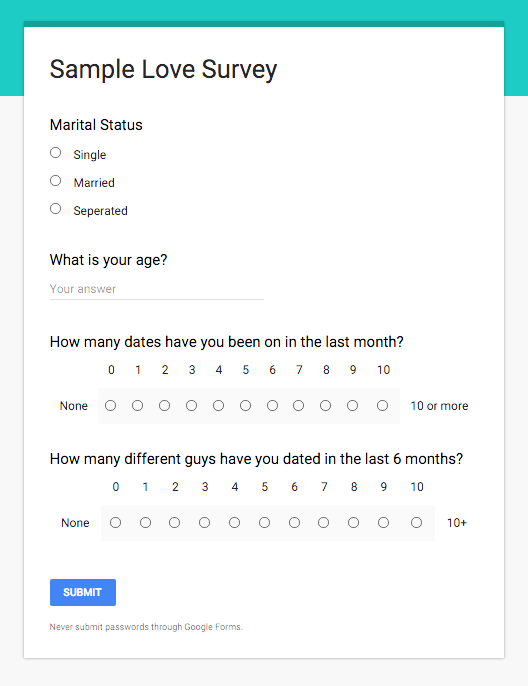
Sample Survey
For example: Let’s say that you assume that your audience is women in their 40’s looking for love who go on a date at least once a month.
Ask about specific past behavior rather than future or general behavior.
Notice, we don’t ask “how many dates do you go on in a month?” as that question asks users to generalize. We don’t want users to estimate or take an average. We want the actual number. Users may realize they go on fewer dates than they imagine.
Send out the survey
Test the survey with a few friends or coworkers first, asking them after if all the questions make sense. Check if their answers make sense based on what you know about them.
Analyze the results
Remember our sample survey? Analyze different relevant combinations until you have a clear picture of the user in terms of the measured behavior.
For example:
- We can analyze the results by counting how many women are both in their 40’s and who go on a date at least once a month.
- We could also analyze the opposite side of the spectrum: Women in their 40’s who go on lots of dates each month
If you are using a CRM like Marketo, you should be able to send out a survey that will tag or segment your list automatically based on their responses. Otherwise, you can use Google Forms, SurveyMonkey or Typeform (just make sure your last survey field asks for the e-mail address so you can segment your list manually).
3. Analyze Customer Support Requests
Your support team knows a lot about the customers. Don’t overlook them as an impromptu user research team.
Get customer support’s viewpoint
You can start by asking their assumptions about users based on their experience. Take this with a grain of salt, however, since they only deal with users who reach out (response bias).
Ask the following questions:
- Who do you think the different kinds of users are?
- What is their biggest problem that we can solve?
- What is their biggest technological problem with our platform that we can improve?
- What do users appreciate most about what we do?
- What do users frequently complain about?
Empower customer support with simple user research tools
By keeping track of the nature of support requests and comments, you begin to get a data-driven picture of the user.
- Create a support/comment form that customer support can help fill out for each incoming request. You can use Google Forms, Typeform, SurveyMonkey or any other survey tool. For small businesses, 20-30 responses starts to yield actionable data (scale up as needed).
- Decide what is most important about the requests that are actionable.
- Make it short so you don’t slow down your support team.
- Use dropdown fields categories wherever possible. Open text fields are harder to analyze.
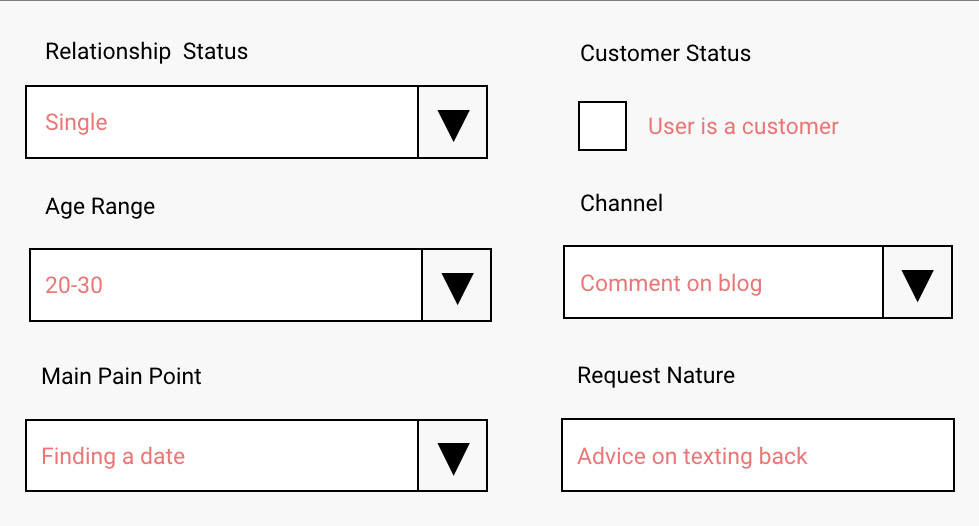
Analyzing the support requests/comments
The survey tool should analyze the data automatically. Look at the general trends.
For the open text fields (in this case “Request Nature”) scan them and write down any patterns you see.
Grab design ebooks created by best designers
All for free


Do you want to know more about UI Design?
Download 'The UX Design Builder’s Ebook Bundle' FOR FREE!
Download e-book for free4. Give your data meaning
By synthesizing the data into personas, you create a visual document that’s easily understood by other designers and your client or stakeholder.
We’ll do some affinity diagramming to create fast personas:
i. Write out a list of your different user groups (e.g. “Single but dating”). Number the post-it, or use a different color to represent a different user group. Write out each relevant finding from all your data on the Post-it notes.
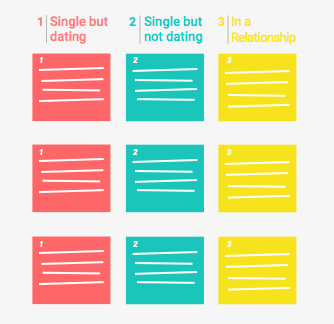
ii. Within each user group, start clustering similar behaviors together. Now you can start to see trends for each user type. You can summarize the behaviors and characteristics in a persona for each user group.
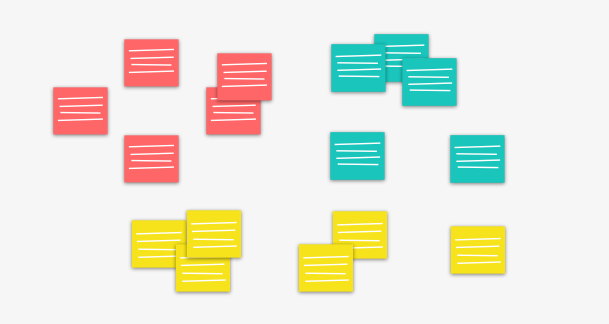
Quick Affinity Diagram
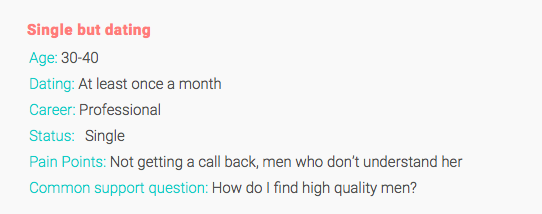
Sample Persona
Need some empathy?
Another way to summarize each user group is through an empathy map.
In these maps you describe what the user is thinking, hearing, feeling, doing, saying and seeing. When you are designing or writing copy, it may be easier to look at a user in this way rather than the above format.
If you want to give it a shot, check out the 10-Minute Guide to Empathy Maps.
Keep user documents handy
Whether you have a persona or empathy map, keep them out when your team is meeting, designing, copywriting, answering support requests, or doing anything related to the user.
Let them become an organizational tool outside of immediate UX design. For example, sales teams might find great value in the customer research when they’re contacting prospects based on pain points.
Share the user documents with everyone on your Google Drive so they can print them out for easy access.
5. Run A/B Testing
Once you’ve created the personas, you can start quickly prototyping targeted solutions. Ideally, you can run a usability test on each prototype iteration.
If your timeline doesn’t allow for that at all, you can push small changes live and A/B test.
Just remember that A/B testing is great for finding out what users “like” but it doesn’t tell you why.
It can help when you are trying to do the following:
- Adding a feature or test if increases engagement or conversions
- Seeing which copy results in more engagement or conversions
- Seeing if users like a particular design vs. another design
Your developer or engineer can do A/B testing for web sites or apps. Some e-mail platforms let you A/B test e-mails and many advertising platforms let you A/B test different creative.
For example:
We added a persistent navigation to my client’s sales page to see if we could increases conversions.
We hoped the persistent navigation would help users understand what is on the sales page and get a better sense of the product. Therefore, you A/B test one page with the navigation and another without.
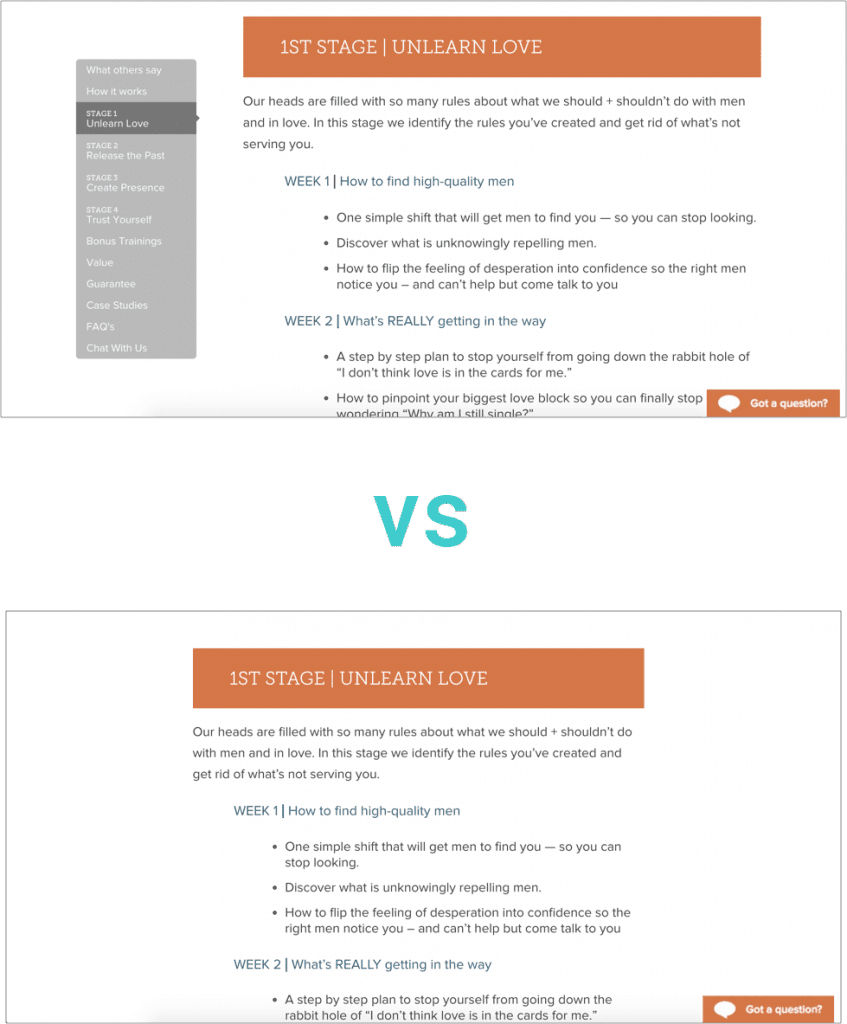
A/B testing the gray persistent navigation on the left
Result: A/B testing concluded that users engaged the page more with the persistent navigation. In this example, we defined more engagement as: “users spent more time on the page and clicked more”.
Again, it doesn’t tell you why you have more or less engagement.
To determine the rationale, you can examine your site analytics, customer support data and survey data. Even better, you could test the new version (in this case, the persistent navigation) with 5 users either in your office or remotely. Tools like Usertesting, in fact, can help you recruit users and run a test for as little as $50.
If you’d like to learn more about 30+ other ways to conduct an insightful usability test, check out the free Guide to Usability Testing.
6. Reframe the conversation
Now that you know who the user is and you’ve tested some changes, you can start defending design decisions based on real data. When it comes to business stakeholders, nothing proves more convincing than real data.
Start by reframing questions and statements you or the client may have. Note whether your target audience in mind is a specific persona or all of your personas.
Here are some examples:
- Instead of asking a client or stakeholder “Do you guys like this?”, ask “Would the target user for this campaign like it?”
- If you hear “I hate how this looks”, ask “Have we tested user engagement for this design?”
- Instead of just asking “Do you guys like this copy?”, try saying “Let’s A/B test it!” or “Based on our user data, it wouldn’t make sense to that user.”
- If you hear “I want to make this header bigger.”, you could counter with “There is more than sufficient visual contrast that makes the header stand out. A quick usability test revealed that people can remember the header after looking at the page.”
Of course you won’t win all the time, but choose your battles wisely. Rely on user data to backup decisions you make when possible. Argue over what the data means rather than what you believe.
And just like that, you’re on a clearer path to user-centered design without breaking your budget.