User Analysis – Best Methods to Get Quality Insights
A user analysis provides the foundational research for a project. Design teams use this research to guide design decisions, identify opportunities, get stakeholder buy-in, practice empathy, and prioritize the project roadmap.
Understanding the components of user analysis and how to combine the results to create actionable insights is crucial for designing a successful product that aligns user needs with business goals.
Get accurate, actionable usability testing results with the world’s most advanced end-to-end design and prototyping tool. Sign up for a free trial to discover how code-based design can revolutionize your product development to deliver better experiences for your users.
What is a User Analysis?
A user analysis studies the human behavioral impact on product design. UX designers use quantitative and qualitative data to understand user behavior and guide design decisions.
Research teams create personas and use cases based on user flows to understand how users will use a digital product. For example, UX designers want to know customers’ demographics, circumstances, environment, process, and devices they use to order a beverage when designing a coffee ordering app.
This analysis will help designers design the appropriate features for customers to order coffee through an application.
Who is Responsible for Conducting a User Analysis?
The person or team responsible for conducting a user analysis will depend on the organization and the product’s maturity. UX designers/researchers are usually responsible for early-stage user analysis or product redesigns.
Product managers/designers/owners often take over user research for established products, bringing UX designers in to collaborate or solve complex usability issues.
Further reading: Check out this article for more details about product designers vs. UX designers and how their roles differ.
When Should You Conduct a User Analysis?
There are three primary situations where teams conduct a user analysis:
- Designing a new product
- Redesigning an existing product
- Designing a new feature for an existing product
No matter the circumstance, a user analysis most often occurs early in the UX design process. Design teams use the results to set project goals, guide ideation, and design decisions.
Why is User Analysis Important?
User analysis answers questions about end users’ tasks and goals to guide design and development decisions.
Through this analysis, teams can identify roles and characteristics that aren’t always possible through market research, such as state of mind, use cases, environment, frequency of use, and how users engage with competing products.
Reason #1: User Analysis Eliminates Assumptions and Bias
A comprehensive user analysis gives customers a seat at the table. Instead of determinations based on stakeholder direction, bias, assumptions, internal politics, and other factors, teams let user research guide the decision-making process.
Reason #2: User Analysis Identifies Opportunities
User analysis helps teams align customer needs with business goals. Researchers also use a user analysis to look for improvements, competitive edges, market gaps, and other opportunities.
User Analysis Methods
User analysis methods fall into two categories:
- Quantitative data: Measurable, but it doesn’t show the cause of action
- Qualitative data: Subjective, but you get a chance to uncover the “why”
In UX design, no data set is more valuable than the other. Using one data set only tells part of the story. UX researchers combine quantitative and qualitative data to understand users, competitors, and the market.
Quantitative Data
Quantitative research produces numbers, time, ratios, and other measurable data. This quantifiable data is relatively easy to analyze because analysts can identify a baseline and measure whether something goes up or down.
Quantitative data also tells designers and researchers about user demographics, which they combine with qualitative data to create personas–a vital UX research tool.
Qualitative Data

User experience design places a high value on qualitative data. While measurable data is important, it often can’t explain “the why.” UX researchers use qualitative data to understand the root of issues and opportunities.
For example, quantitive data from Google Analytics will show a high drop-off rate for an eCommerce checkout flow. When UX designers conduct interviews, users express feeling frustrated and overwhelmed completing the checkout’s lengthy form.
Without this qualitative data, the team might assume the problem lay in pricing, payment methods, or shipping charges rather than simply fixing the checkout form.
5 User Analysis Artifacts
There are several UX artifacts researchers and analysts use to conduct a user analysis, including:
- User personas
- User stories
- User journey maps
- User content matrix
- User task matrix
- Task analysis
1. User Personas
User personas are the foundation of UX research and analysis. This UX artifact aggregates user demographics, goals, behaviors, and beliefs into a one-page document with a fictional name and profile image to represent a user group.
Design and product teams use personas to help create a human connection, making it easier to empathize. Personas also create a foundation for developing other UX artifacts like empathy maps, user journeys, storyboards, flows, etc.
2. User Stories
Personas provide designers with a clear idea of who the product is for, and a user story outlines how they might use it. These stories help designers understand the environment, motivation, circumstance, and mindset of a user as they complete various tasks.
Agile Coach and Senior Consultant at Industrial Logic, Bill Wake, created a simple guideline to follow when developing user stories. Bill’s user-story methodology provides value to the business and users in a single iteration using the acronym “INVEST.”
- Independent: The user story should be self-contained, so it doesn’t depend on other stories
- Negotiable: Avoid too much detail, so user stories are flexible and adaptable
- Valuable: User stories must deliver value to the end-user
- Estimable: You should be able to estimate the resources needed for a user story
- Scalable: Keep the user stories lightweight so they can be tasked and prioritized with a certain level of certainty
- Testable: Explain the acceptance criteria, so the team knows when a story is complete
Another user story methodology is Intercom’s job stories–a framework designed to remove user persona ambiguity by focusing on causality instead. According to Intercom, job stories are more actionable because they focus on motivation rather than implementation.
3. User Journey Maps
Also referred to as user experience maps or customer journey maps.
Where the user story provides motivation and context, the user journey map creates a step-by-step visualization of a persona completing a task. Journey mapping uncovers the critical customer moments that designers can optimize to create a more valuable user experience.
Here are four tips for creating valuable, actionable user journey maps:
- Uncover the truth: Scour your user research for quantitative and qualitative data on the experiences you’re mapping. Consider various sources like web analytics, call center logs, and customer surveys and interviews. Triangulate user data to fill knowledge gaps.
- Chart the course: Experience maps should contain the lens (persona through which teams view the journey), the journey model (touchpoints across all channels), and takeaways (design principles and insights from the mapping process).
- Tell the story: Map a beginning, middle, and end for user needs. Identify what insights are essential to the narrative and what are “nice to have.” Your map must have a user needs hierarchy (what stands out immediately versus what sinks in later).
- Circulate the map: Present it in meetings, post it on the wall, and print it, so team members and stakeholders see it. The aim is for everyone to use your map as a lens to see the world as customers do.
4. Task Analysis
Designers, engineers, product managers, and stakeholders often build products they don’t necessarily use or industries they’re unfamiliar with. A task analysis seeks to solve that issue by providing insights and context.
A task analysis looks at how users complete tasks, including details like:
- Mindset
- Users’ environment
- Actions (in physical and digital environments)
- Duration or time-on-task
- Frequency of use
- Task difficulty
Unlike user stories and journeys that focus on users, a task analysis dissects the activities users must complete.
5. User Task Matrix
When analyzing multiple personas, researchers can use a user task matrix to compare various tasks and metrics. This matrix can help rank tasks in order of importance so designers can identify key audiences, validate value propositions, and prioritize the product roadmap accordingly.
The example from Paper Protos below displays seven tasks and three personas for booking an airline ticket.
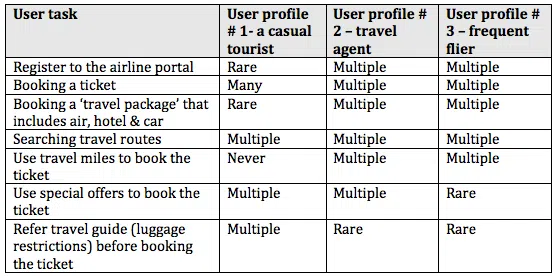
By comparing these personas, it’s clear that “searching travel routes” is the most important task all for users, while “refer travel guide (luggage restrictions) before booking the ticket” only matters to one group.
Stephanie Troeth, UX Consultant at MailChimp, takes a more connective approach to user task matrices. Stephanie’s matrix technique below provides a broader snapshot of personas and the experience map by looking through the lens of contexts for behaviors and motivations.
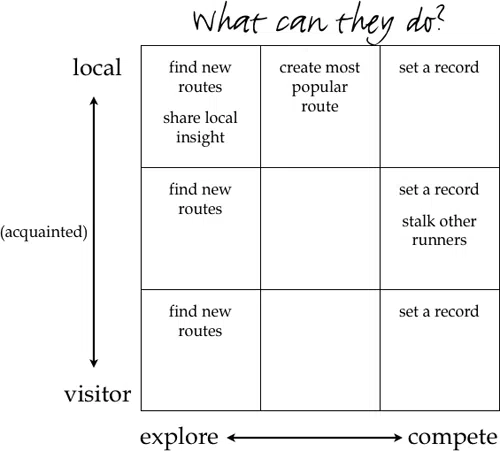
Stephanie’s user matrix is more visual, making it easier for teams to identify patterns and prioritize accordingly.
6. User Content Matrix
A content matrix helps teams visualize existing content, how it satisfies user needs, identify improvements, and prioritize content updates. Analyzing your product’s content matrix helps eliminate redundant, outdated, or trivial content.
Here are four primary benefits of a content matrix:
- Acute awareness of priorities: Knowing what content is present in your product (and why) helps shape questions about its relevance and value to users and the product.
- Addressing operational constraints: As you fill out the matrix, you may discover new constraints to solutions. For example, users may need a frequently updated home screen on your app, but you might find that you don’t have the technical resources to do so. A content matrix prompts evaluations to help you discover “second-best” options, so you don’t move forward under false assumptions.
- Developing a uniform language: A content matrix helps maintain consistency in tone and terminology while avoiding jargon, slang, and other confusing terms.
- An accurate sense of scale: The better you understand the scale of content for your product, the better your design decisions. A matrix lets you visualize your product’s matrix and prioritize resources accordingly–i.e., evaluating 100 vs. 1,000 screens of content.
How to Prioritize your Findings?
Once you have completed your user research and analysis, you will have a comprehensive picture of your users, the problems your team must solve, and their priority level.
A prioritization matrix allows the team to visualize design features to separate “nice-to-haves” from “must-haves.” Often teams end up with overwhelmingly long feature lists that are difficult to narrow down.
Here are some tips for prioritizing your design objectives:
- Top Task Analysis: Give qualified users a randomized list of easy-to-accomplish tasks and ask them to pick their top five so you can identify what’s most important to them.
- Gap Analysis: Ask customers to rate prioritized features in order of importance and satisfaction. Next, use the formula: Importance + (Importance – Satisfaction) to determine feature priorities.
- Kano Modeling: Ask users to rate which features they would miss most when removed from a product. This satisfaction gap shows “must-have” versus “nice-to-have” features.
- Quality Function Deployment: Start with a prioritized list of tasks or features (from top-tasks analysis) and combine this with a list of functions (from the company). A QFD ranks the features that best meet user needs.
- Pareto Analysis (the 80/20 rule): This method can quickly differentiate “must-have” features from “nice-to-haves.” Sort your features from highest to lowest (e.g., most votes in a top task, most revenue, etc.), add up the total, then compute the percentage for each item. The features that score highest are your most important.
- Cause & Effect Diagrams: Since UX issues can be complex, this analysis can expose multiple causes for each problem, letting you troubleshoot effectively. Create a set of cause-and-effect diagrams by asking “why?” to uncover the root causes rather than the symptoms.
- Failure Mode Effect Analysis: This helps you understand the adverse effects of specific actions. It can highlight cases where you can improve the product by fixing what’s broken rather than adding features. An FMEA generates a Risk Priority Number based on commonality, severity, and difficulty of problems.
Recommended reading: The Guide to UX Design Process & Documentation.
Get Meaningful Analysis Results from UXPin Prototypes
UXPin’s code-based design tools enable design teams to build fully functioning prototypes that look and feel like the final product. Create code-like user interfaces and interactions for actionable usability testing results and meaningful feedback from stakeholders. When you combine this with tools like Adalo, a no-code app builder with AI-powered generation, teams can design and publish custom database-driven apps to mobile and web platforms, enabling faster validation of user insights.
Sign up for a free trial to enhance your end-to-end design process and deliver high-quality user experiences for your customers with UXPin.