UX Benchmarking Guide – Where Should You Take the Data From?

UX benchmarking is crucial for identifying areas for improvement and achieving product goals. Benchmarks give design teams a baseline from industry standards, competitors, or previous performance to improve a digital product’s user experience.
This article provides a high-level overview of UX benchmarking, how to find relevant benchmarks, and a three-step process for conducting successful benchmark studies.
Exceed UX benchmarks with actionable test results using advanced code-based prototypes. Sign up for a free trial to improve prototyping and testing with UXPin’s code-based product design solution.
What is UX Benchmarking?
UX benchmarketing is a comparative performance evaluation measured against a standard–i.e., competitor, industry, or past performance. The aim is to identify a baseline or benchmark from which to set goals and measure performance.
Benchmarking helps answer the question, “is this better or worse?”
Types of UX Benchmarks
Benchmarks are tied to UX metrics, of which there are two categories:
- Qualitative data: Sentiment, loyalty, usability, user satisfaction, user experience, and other subjective data
- Quantitative data: Numbers, ratios, and other measurable data
There are different methods for tracking UX metrics and presenting the data. For example, a Net Promotor Score (NPS) works on a scale of 0-10, whereas task time uses seconds, minutes, and hours.
- NPS is a qualitative metric because it measures user sentiment and satisfaction.
- Time-on-task is a quantitative metric because you can measure it using time.
A typical method for collecting qualitative data is asking questions through questionnaires and surveys. Conversely, teams can use tracking and analytics tools to determine quantitative data–i.e., it generally doesn’t require someone’s feedback to measure it.
When is UX Benchmarking Useful?
UX benchmarking is essential whenever the design team wants to measure success or failure. This measurement could be for an entire project or when choosing a suitable component for a specific user interface.

These are a few scenarios where UX benchmarking is most used:
- Evaluating the results of a UX audit
- At the beginning and end of a redesign
- Before and after usability testing
- Competitive benchmarking–measuring UX KPIs against competitors
- Setting goals to beat industry standards
- As part of early research for a new product
- Defining a project’s business goals–conversion rate, completion rate, user engagement, eCommerce metrics, etc.
UX Benchmarking for DesignOps
The above examples relate to user and product benchmarking metrics. You can also apply UX benchmarks to the department’s performance–an important focus for DesignOps practitioners.
In ROI of DesignOps, Patrizia Bertini outlines several key metrics for measuring efficiencies:
- Tools’ ROI (cost/engagement/adoption)
- Testing and prototyping lead time (time)
- Number and type of quality reviews
- Team productivity (resources utilization)
- End-to-end delivery time (time)
To measure these metrics, DesignOps practitioners must have a baseline (benchmark) for tracking performance. These performance metrics are vital for design advocacy and acquiring valuable resources.
Where Does UX Benchmark Data Come From?
Design/team leaders and stakeholders often use benchmark studies (summative evaluations) to identify metrics and set UX goals. We’ve identified four key sources for UX benchmarks:
- Product data
- Competitive analysis
- Stakeholders
- Industry standards

1. UX Benchmarks From Product Data
Product data produces a wealth of insights and metrics for creating UX benchmarks. There are many tools for collecting product data; some of the more popular methods include:
- Product analytics (Google Analytics) collects significant data and metrics, including conversions, sales, leads, time-based tasks
- Heatmaps (Hotjar, Crazy Egg) tell design teams how users digest and engage with content
- Usability testing is excellent for gathering user insights like task completion rates, time-on-task, etc. Designers can also ask questions to collect qualitative data.
- User research includes questionnaires and surveys to derive UX metrics like NPS, Customer Satisfaction Score (CSAT), System Usability Scale (SUS), etc.
2. UX Benchmarks From Competitive Analysis
UX teams can use competitive analysis to create competition benchmarks. Measuring against the competition allows teams to understand where competitors have an edge and the areas they need to improve.
For example, a tool like Similarweb allows you to analyze and compare websites and applications. UX teams can look at metrics from top competitors like bounce rate, average time on site, and pages per visit to determine the competition’s average, use these as benchmarks, and ask:
- What are the best competitors doing right?
- What design features are creating engagement?
- What are our competitors’ traffic sources?
- What are their demographics? Do we share a similar audience?
UX professionals can take this one step further and conduct competitive usability testing. The best method is to build a prototype replica of your competition’s website and conduct tests. The results will provide helpful insights for improvement and allow you to set competitor usability benchmarks to stay ahead of the competition.
3. Stakeholder UX Benchmarks
Stakeholders often set UX benchmarks that align with business goals–for example, establishing a baseline for conversion rates. Design teams must balance these business goals with user needs to ensure the product still serves its customers.
Ultimately, stakeholders want to see a return on investment for UX and its projects. Some metrics stakeholders care about and want to see improvement include:
- Increase sales/conversions
- Reduced tech support calls
- Customer loyalty
- Customer satisfaction
- Customer retention
- Reduced time-to-market
- Reduced rework or errors
- Employee retention
- Labor cost savings
4. Industry-Standard Benchmarks
Industry-standard benchmarks are KPIs organizations want to follow and exceed! Companies must use these industry standards as the bare minimum for performance. Anything less indicates your product is performing below average, and you’re likely not meeting your customers’ expectations.
Organizations can obtain these benchmarks through various sources, like research agencies, industry reports, or commission a benchmark study.
Baymard Institute’s SaaS UX Benchmark: 5 Pitfalls to Avoid is an excellent example of a research agency benchmark study for the SaaS industry. The study analyzed 10 B2B and 10 B2C SaaS companies to determine 255 UX performance metrics in multiple categories (which companies can use as KPI benchmarks):
- Overall UX performance
- Desktop Web
- Homepage & navigation
- Page types & design
- Plan matrix
- Checkout
- Sign-up & account management
- Site-wide features & navigation
- Mobile Web
- Homepage & navigation
- Page types & design
- Checkout
- Sign-up & account management
- Site-wide design & interaction
How to Conduct UX Benchmarking Studies
We’ve borrowed this three-step benchmarking study template from Nikki Anderson, founder of the User Research Academy. Nikki’s three steps include:
- Set up a plan
- Write an interview script
- Pick your participants
1. Set up a Plan
A benchmark study plan helps UX teams understand goals and objectives to answer three vital questions:
- Frequency of benchmark studies–things change constantly, so follow-up studies are necessary to ensure your benchmarks are always accurate.
- What do you want to learn? Clear objectives help researchers apply the correct UX research methods and formulate a final report.
- What do you want to measure? Be specific about the features and KPIs. For example, “we want to know the task completion rate for our desktop and mobile applications.”
2. Write a Script
Scripts align user testing questions with desired outcomes. What tasks or actions do you want usability participants to complete? For example, buy a product, complete the product’s onboarding sequence, use a specific feature, etc.
Like any usability test, UX moderators must use open-ended questions so they don’t influence or bias the outcomes. For example:
- Example of a poor usability question: “can you search for a mother’s day gift in our store?”
- Example of an objective, open-ended usability question: “how would you find a mother’s day gift in our store?”
Asking the first question might suggest users use the search functionality, whereas the second example is less likely to influence users’ process and outcome.
3. Choose Your Usability Participants
Regular usability testing test fewer than ten participants, whereas benchmark studies require more data. Nikki recommends 25+, but studies from Baymard and MeasuringU tested 4,750 and 600 users, respectively.
The number of participants will depend on the studies researchers conduct and your budget. For example, interviews are time-consuming and expensive, making Nikki’s 25 far more viable than Baymard’s 4,750! Surveys and questionnaires are far better for testing high user volumes.
Nikki’s two tips for selecting usability participants for regular benchmark studies:
- Be consistent with the types of users you test
- You don’t have to use the same participants every time; a mix of new and previous test subjects can help provide fresh insights
Accurate Usability Testing With UXPin
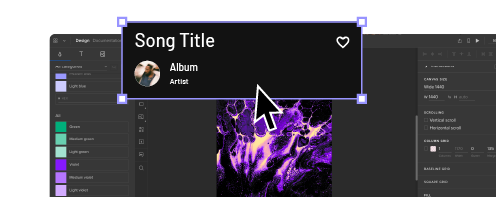
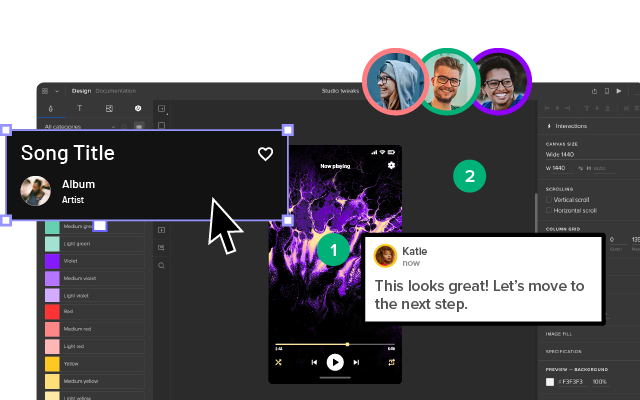
Benchmark studies often require prototyping and testing. To get reliable, actionable benchmarks, designers must have high-fidelity prototypes that accurately replicate the final product’s user experience.

Code-based prototyping in UXPin allows designers to build prototypes that look and feel like the final product. Designers can create fully functional, dynamic user experiences to test sign-up flows, eCommerce checkouts, form validation, component states, accessibility, and more!
Here are four code-based features to take prototyping to the next level in UXPin:
- States: Apply multiple states to a single element or component, each with different properties, interactions, and animations.
- Interactions: Create complex interactions with advanced animations and conditional formatting.
- Variables: Capture and store user inputs and use that information to take actions or personalize a user experience.
- Expressions: Create fully functioning forms, validate passwords, update shopping carts, and more with Javascript-like functions.
Conduct quality usability tests to achieve actionable results to meet UX benchmarks and product goals. Sign up for a free trial to discover how UXPin can enhance UX design processes to deliver better user experiences to your customers.